Each article takes one question about New York City and works out what the public
data can say about it. Every article ships with interactive charts, the dataset it
used and the code that reproduces its numbers, and lists the source of every
external figure it quotes.
From 2016 to 2025 New York permitted 2.8 homes a year per 1,000 residents, the lowest of five big cities on each one's own measure; Tokyo started 9.7.
New York finished more homes in 2025 than in any year of the City's housing records, and its permits nearly doubled through September. Per resident, how do those numbers compare with London, Paris, Toronto and Tokyo, and with New York's own past?
In 2025 New York had 3.6 murders per 100,000 residents, the highest of five big cities and more than three times London's 1.1, after falling 88% since 1990.
The NYPD reports its fewest murders on record for the first nine months of 2026, a record count rather than a record rate. New York's 2025 rate was still the highest of five big cities. Will this year's fall narrow the gap with London?
In the Board's count, a third of 2025's ballots were cast early; the survey's long view puts in-person Election Day voting at 96% before 2019 and 47% in 2024.
Until 2019, almost every New York City voter cast a ballot in person on Election Day. By 2024, about half did; most of the rest voted early or by mail. Early voting for the governor's race began on 24 October. Is this year running ahead of 2022, and do most early voters really wait for the last weekend?
Naturalized citizens were 32% of the city's adult citizens in 2024, between 31% and 33% in every yearly estimate from 2012 through 2024, after nearly doubling from 1990's share.
Who can vote in New York City? Citizenship and age are two of the rules, and the Census Bureau's yearly survey estimated 5.6 million citizens 18 and older in 2024. Nearly a third were born abroad and naturalized, about twice the share of 1990. Another 1.2 million adults weren't citizens at all. Could new citizens decide this election?
Two million ballots in the 2025 mayoral election, the most for a mayor since 1969: 39 per hundred adult citizens, nearly double 2021's and above any mayoral race since 1993.
Last November's mayoral election drew more than two million ballots, the most for a mayoral election since 1969. Per adult citizen, turnout nearly doubled from the mayoral race before it. Governor's races have rebounded before and then fallen back. Will this one hold up?
In New York's last four midterms, 28% of adult citizens under 30 said they voted, against 47% of those 65 and over: a 19-point gap, 12 in presidential years.
In presidential years 57% of New York City's adult citizens say they voted; in the midterms, when the governor is on the ballot, 39%. Adults under 45 report the biggest drop, and in those midterms the gap between old and young is wider than between a degree and none. Young adults do report voting, when a president is on the ballot. Has the midterm age gap always been this wide?
New York City's unemployment rate was 4.8% in September 2026, above the nation's; in the survey's latest year, most of the gap was spells of six months or more.
New York City's unemployment rate was 4.8% in September, six tenths above the nation's. For fifty years the city's rate has usually been the higher one. Whose unemployment makes the difference? In the latest year of the monthly survey, most of the gap was unemployment lasting six months or more. On one benchmark, the city's mix of workers would put its rate about level with the nation's. Do the long spells end in jobs, or in leaving the labour force?
Through September 2026, 52% of wage-earning New Yorkers earned under $30 an hour. Since 1989 the floor nearly doubled after inflation; the median ended near where it began.
New York City's general minimum wage stays at $17 on New Year's Day. A Council bill would take the rate for large employers to $30 by 2030. Through September, 52% of city residents who work for wages earned less than that. Most private-sector workers under the line work full-time. Since 1989 the legal floor nearly doubled after inflation, while typical pay ended near where it began. What would a much higher floor change?
In January to May 2026, felony assault per subway entry was about twice its 2019 rate, counting unpaid entries, while the six major felonies together sit close to 2019.
Is the subway safer? Early this month the NYPD called 2026 so far the second safest year in its transit system in fifteen, the pandemic years left out. Days later two stabbings put riders on alert. Both can be true. Per ride, the police record a third as many major felonies as in 1998, and the year to June sits close to 2019 once fare evaders are counted as riders. One crime went the other way. Felony assault runs at about twice its 2019 rate, and it was climbing before the pandemic emptied the trains. Two things often said about the trains, that crime is only down because fewer people ride and that a wider law made the assaults, get tested against the counts. What they can't say is the question riders ask: why did assault go the other way?
New York's thirty-year fall in road deaths belongs to people on foot and in cars. Deaths on two wheels rose, to about 71 a year in the early 2020s.
New York counted 205 traffic deaths in 2025, the fewest since its count began in 1910. Over thirty years of federal records, deaths on foot and in cars fell by half or more. Deaths on two wheels did not: one in ten of the dead in 1995, nearly three in ten in 2024. The police records put the new deaths on e-bikes, e-scooters and mopeds, a vehicle the Vision Zero plan of 2014 doesn't name. We set the counts beside the growth of app delivery, the legalisation of 2020 and the new 15 mph limit. Then we test what was said at the Council's hearing, starting with the claim that e-bike deaths are up again this year. The question the crash records can't answer on their own is the one the city most needs answered: has riding got riskier, or are there simply far more riders?
Shootings in 2025 were the fewest in the NYPD's open files, which begin in 2006; recorded felony assaults passed 1998's count, on a definition that has widened.
New York's fall in gun violence is real, but it isn't the whole story. Shootings in 2025 were the fewest in the NYPD's open files, and murders this year are running a fifth below last year's. Yet felony assault, the most common violent felony, is up 44% since 2019 and past the NYPD's own 1998 benchmark. Why are the two moving apart? And why, while shootings fall, were nearly twice as many people under eighteen shot as in 2019? We follow both series through thirty-five years of records and ask how much of the rise the law's wider definition can explain. Then we test four things New Yorkers say about the violence, starting with the bail law. The one thing the files can't say is the one everyone argues about: why.
Last winter's record of about 305,000 no-heat complaints was not just the cold: at the pre-pandemic rate its weather would have brought about 206,000; it brought 48% more.
New York's heat season opened on 1 October after a second record winter in a row: about 305,000 complaints of no heat, in the coldest winter in eleven years. Its weather alone would have predicted about 206,000. Inspectors found more than twice as many heat violations as in a winter before the pandemic, and more of the complaints come from the same buildings each year. And the record barely sees public housing. There, the City's own survey says, nearly four in ten households had their heat break down for six hours or more in the winter of 2021-22; almost none of it reaches HPD's complaints. Thirty winters of records say who stays warm in New York. Whose cold goes uncounted?
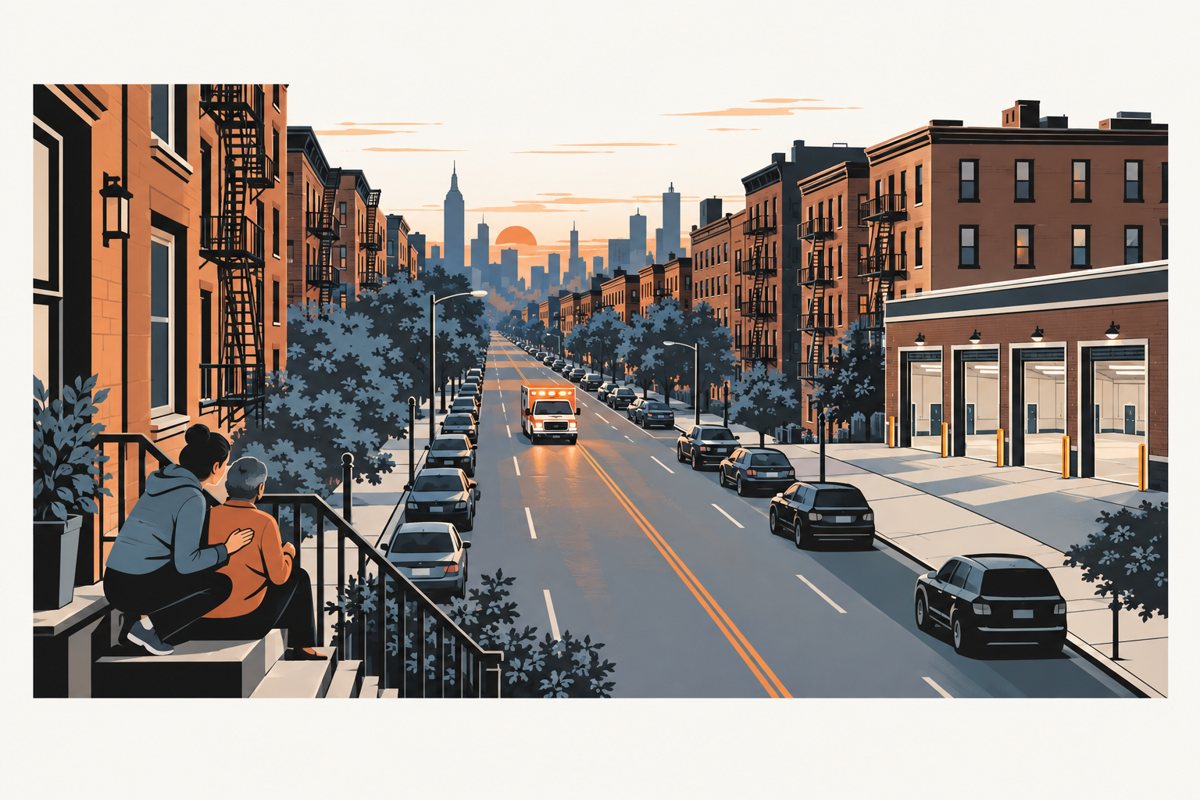
Ambulance response to calls ultimately classed as life-threatening rose by a minute and three-quarters in fiscal 2026, to the slowest year in the city's figures since 1988. The extra time appears before and after an ambulance is assigned, not in the 911 call. For calls urgent from the start the rise was about a minute, most of it after assignment, as ambulance capacity fell and calls did not rise.
The Mayor's Management Report says ambulances took 10:32 on average to reach life-threatening medical emergencies in fiscal 2026, up 1:43; the FDNY's dispatch records reproduce it within five seconds (10:37, up 1:45). In the city's own figures, which run back to fiscal 1988, it is the largest one-year rise and the slowest year since 1988: thirty years ago, in fiscal 1996, the year the Emergency Medical Service merged into the Fire Department, the figure was 8:58, and it fell to a low of 6:25 in fiscal 2012 before rising five years running. Call-taking barely moved (five seconds); the time from job creation to first assignment rose 51 seconds and the trip from assignment to arrival 54. That headline counts calls by their final coding and times upgraded calls, about one in eight, from the original call. For calls life-threatening from the start the rise was 56 seconds (57 under the initial-coding definition), with under ten seconds before assignment and 47 after; upgraded calls account for 64 of the 105 seconds in a shift-share decomposition, and the public file cannot separate their queueing from time spent at a lower priority. Calls held because no unit could be assigned at once rose from 6.9% to 11.5%. Ambulance in-service hours fell 5.4% while all ambulance incidents fell 0.6%, about 5% more calls per unit of capacity; hospital turnaround was flat and fire engines on the same kind of call slowed by eleven seconds, so the evidence converges on tighter ambulance capacity, though the data do not identify the cause. Every borough slowed, and the summer of 2026 was slower still.
A rent freeze can't pick its tenants, and how its value splits depends on the yardstick: in dollars, better-off households get a little more than their share, because they pay higher rents; against income, the poorest gain the most. Three in ten stabilized households earn six figures, and two in three with any income fall below 80% of HUD's income limit for their household size.
On 25 June 2026 the Rent Guidelines Board set no increase for one- or two-year rent-stabilized leases starting from 1 October 2026 to 30 September 2027: the fourth one-year freeze in the board's 58 orders and the first to freeze a two-year lease for its whole term. In the latest Housing and Vacancy Survey, from 2023, about 960,000 households lived in stabilized apartments; 30% had 2022 incomes of $100,000 or more and 66% of those with any income were below 80% of HUD's income limit for their household size, the line HUD generally calls low income: largely different households. Over thirty years of the survey, counting incomes in 2022 dollars, between 19% and 23% of stabilized households earned six figures in every survey from 1993 to 2014 (among market renters the share rose from 22% to 35%), and every survey since, each counting somewhat differently, has put it higher; in every survey since 1993, six-figure households have paid more than their share of the stabilized rent, from 26% of it in 1993 to 39% in 2023. Carrying the lease dates households reported in 2023 forward, about four in five renew while the freeze is in force. Against the previous year's increases repeated (3% for a one-year lease, 4.5% for a two-year lease), a benchmark above the 0% to 2% and 0% to 4% ranges the board itself proposed in May, a household renewing under the freeze typically saves about $600 a year at 2023 rents (about $430 against the top of those ranges). Because the saving is mostly a slice of the rent, households earning $100,000 or more account for 39% of the modeled rent reduction while making up 31% of the households renewing under it, and 61% still goes to households under six figures; relative to income, the saving is about 4% for households under $25,000 and 0.3% for those at $200,000 or more.
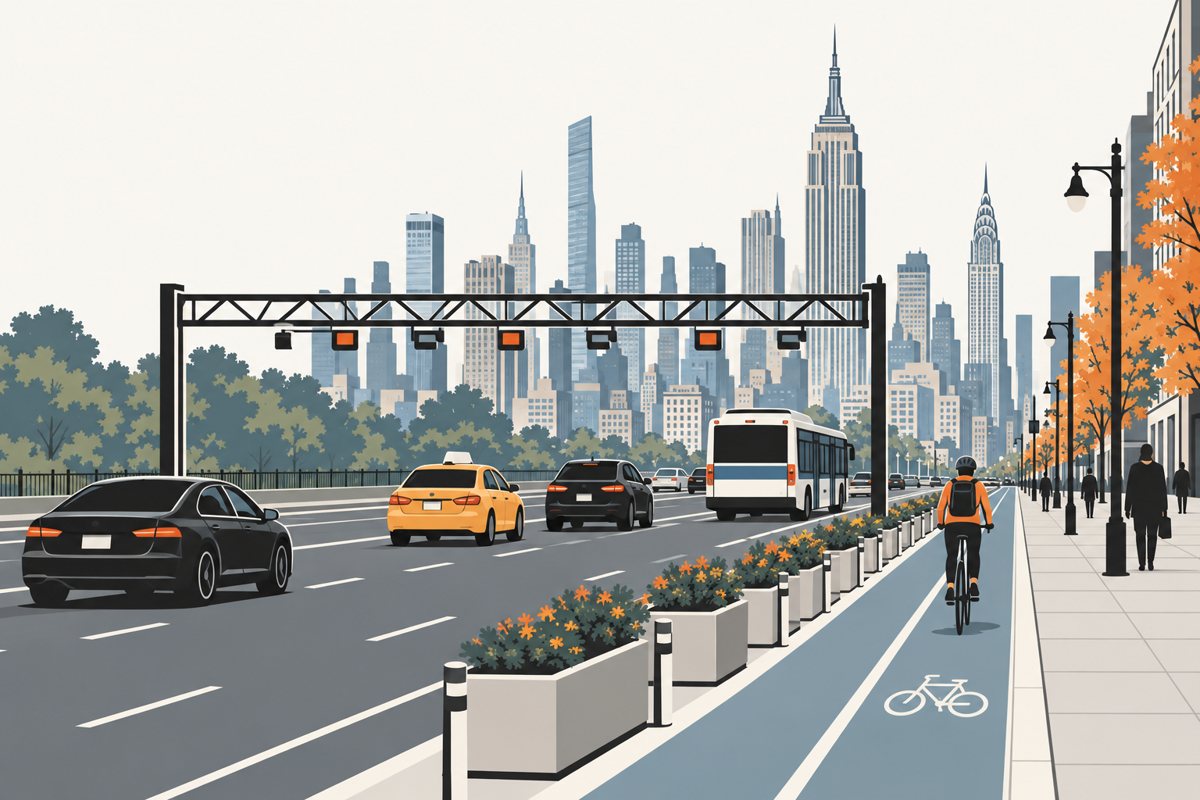
Twenty months in, fewer vehicles are entering Manhattan's toll zone than in its first year, but a count at the door is not a measure of congestion. The speed measures answer different questions: the city's yellow-taxi indicator fell, the state's before-and-after figures rose, and a Google Maps study estimates the zone is faster than it would have been without the toll.
The congestion toll began on 5 January 2025. From March to 19 September 2026, weekday entries into the zone ran 3.4% below the comparable period of 2025, with every month of 2026 lower: cars, pickups and vans were down 7%, while the MTA's taxi and for-hire class, the cabs and app-based cars billed per trip and more than a third of weekday entries, was up 2%. Speed depends on the measure. The city's indicator for yellow taxis carrying passengers on weekday daytimes fell from 6.9 mph to 6.5 mph between fiscal 2025 and fiscal 2026 (July 2025 to June 2026), its lowest reading in the city's open records; the state reported weekday vehicle speeds in the zone up 4% in 2025 and bus speeds up 2.3%; and a working paper revised in August 2026, not yet peer-reviewed, uses Google Maps and five comparison cities to estimate that speeds in the zone were about 11% higher than they would have been without the toll. Over the longer run, on the crossings NYMTC's cordon count has counted the same way throughout, inbound traffic was about a quarter lower in 2024 than in 1998, while the yellow-taxi measure slowed through the 2010s: fewer vehicles at the door has not, on its own, meant faster streets.
New York City has more payroll jobs than ever, a record 4.9 million in July 2026, and health care is its largest sector. The census says what the 4.2 million residents who work actually do and how that changed since 1990: far less factory and clerical work, far more professional and care work, and median annual earnings that rose surprisingly little for a workforce so transformed.
Employers in the five boroughs reported a record 4.9 million jobs on their payrolls in July 2026, and health care and social assistance alone passed a million. The census counts something different, the 4.2 million residents who work, wherever their jobs are: in 2024, 18% of them worked in health care, 17% in professional, management and administrative services and 10% in education, and more held professional or management jobs than service jobs. Since 1990 the resident workforce grew by 900,000 and changed in kind: manufacturing fell from one worker in nine to one in forty and office work from one in five to one in ten, while professional and management work rose from a third of workers to nearly half, and among workers 25 and over the share with a bachelor's degree from a third to 52%. Median annual earnings, in 2024 dollars, ended near their 1990 level: about $56,000 then and $55,000 in 2024 across everyone with earnings, and $69,000 then and $71,000 in 2024 among full-time, full-year workers, a rise of about 3% in 34 years on the New York-metro price index, or 7% on the national research series. Among workers who travel to a workplace in the city, more than a fifth live outside it. Among residents who still travel to a workplace, Manhattan's share is almost what it was in 1990; the change is the one in eight who now work from home. Net payroll growth since 2019 has been dominated by health care and government.
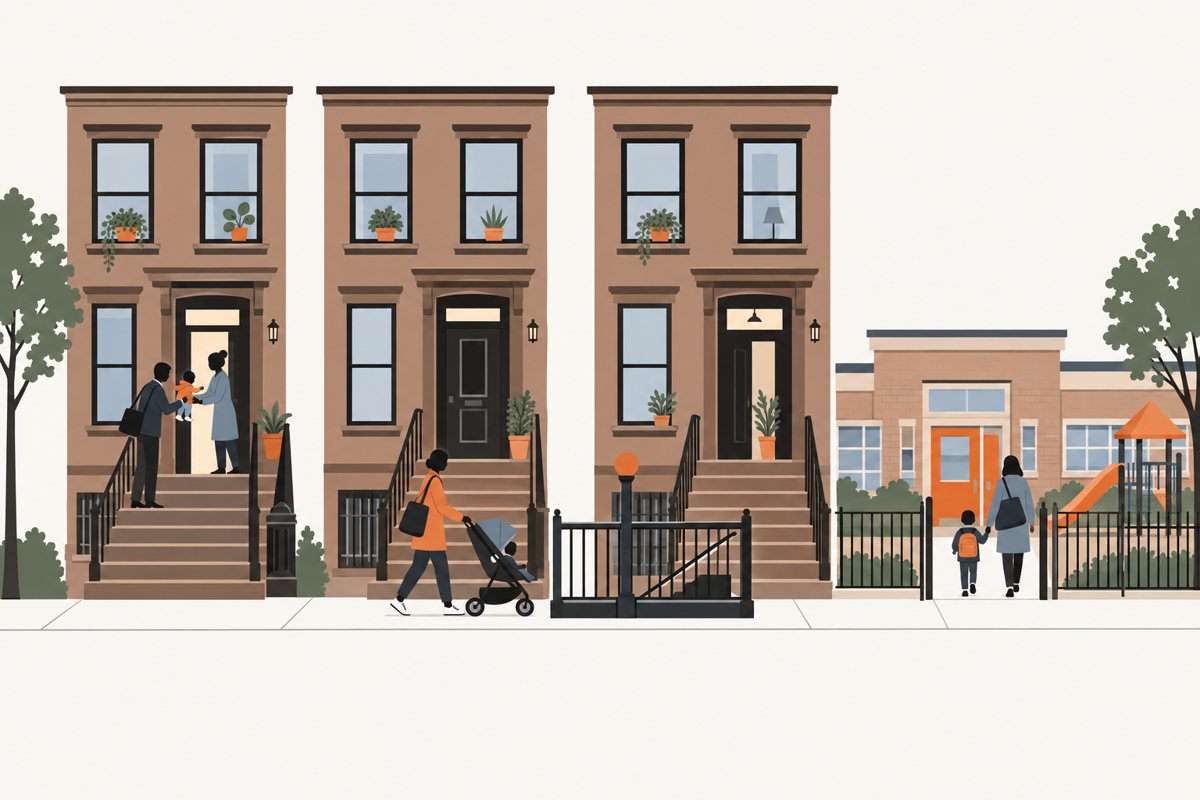
Fewer New Yorkers are raising small children: about 543,000 under six lived in the five boroughs in 2024, 116,000 fewer than in 2015, and births kept falling into 2026. Seven in ten of those living with a parent have every resident parent in the labor force, and before age three, when public help is thinnest, a year of care at the State's rate fits the 7% yardstick for one family in eight.
New York City had about 543,000 children under six in 2024, down from 659,000 in 2015, and births are still falling: those to city residents fell by a fifth between 2015 and 2023, and the City's provisional figures show fewer again in 2025 and the fewest of any first quarter on its provisional record in early 2026. The households raising young children are fewer, higher-earning at the median and more crowded than households without children. Seven in ten of the children living with a parent have every resident parent in the labor force, up from under two thirds a decade ago, and the monthly survey behind the unemployment rate finds about seven in ten mothers of children under six working or looking for work in 2026; mothers of infants are employed about as often as mothers of five-year-olds, and the affluent mother outside the labor force has halved since 2015. The census cannot see who minds the children under three. It can see the price: a year of infant care at the State's rate, $26,000, fits the conventional 7% affordability yardstick for 13% of families with a child under three, and the nannies and day care workers who provide it report medians of $17 and $14 an hour. Public enrolment of three-year-olds went from a quarter to 44% after 3-K, and the first 2,000 free 2-K seats were offered for the fall of 2026. Children aged one to five leave for elsewhere in the country at a higher rate than any group we measured but adults aged 25 to 44, half of them for the suburbs, and the Census Bureau's estimates show the under-five population falling by about a tenth in 2015 to 2020 and again in 2020 to 2025. The years before three, when care costs the most, are the years with the least public help.
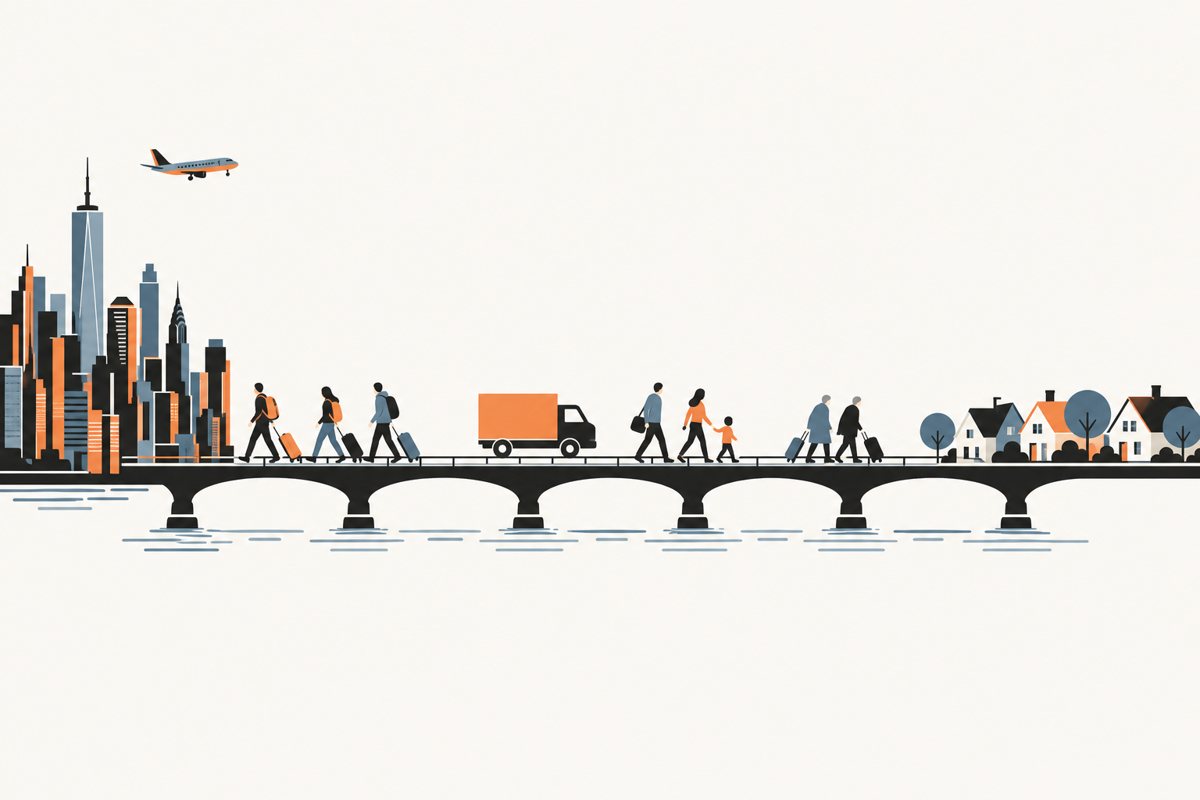
New York is not emptying out; it runs a steady exchange with the rest of the country that ends in a loss every year, a net 114,000 people in the year to July 2025. Arrivals are younger and more often graduates than leavers, and on balance the city loses children. Because the domestic loss recurs, births and above all immigration decide whether the city grows, and immigration is what swung.
In the year to July 2025, the latest the Census Bureau has estimated, New York City lost a net 114,000 people to the rest of the country, gained 66,000 from abroad and ended the year about 12,000 smaller. Through August 2026 the monthly survey shows no detectable rise in the share of residents born abroad, and the shelter census, a separate count, shows no second surge. The census microdata, whose latest year is 2024, says who is in the flows. Every year more people leave for the rest of the United States than move in from it: about 300,000 out and 180,000 in during 2024, a net domestic loss within the survey's margin of 2015's. Departures rose by half during the pandemic, peaking in 2021, and by 2024 they were back where they started. The two groups are not the same people. Domestic arrivals are younger and mostly graduates; a third of leavers go to the metro suburbs, where more than half of those who work outside the home still report a workplace in the five boroughs. Counting people by who they are, the city loses every age group to the rest of the country except 18-to-24-year-olds, who come out about even. The decade's biggest break came from abroad: in the Bureau's latest series, net international migration rose from about 20,000 in the year to July 2021 to 220,000 in the year to July 2024 before falling back. Because the exchange with the rest of the country ends in a loss every year, births and above all immigration decide whether the city grows.
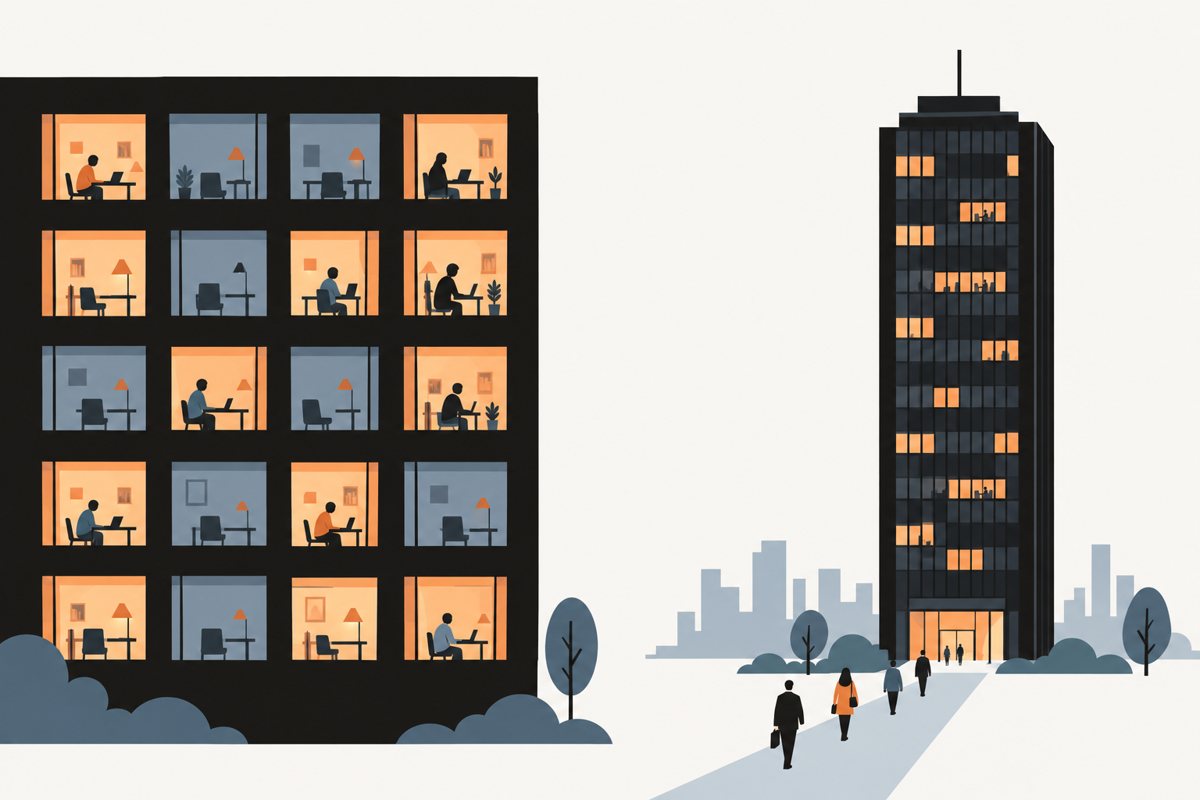
Working from home has settled rather than faded, and it has settled on the better paid. In 2026 about a quarter of New Yorkers at work spend some or all of the week working from home, one in ten all of it, as in 2025. Before the pandemic the share was the same at every pay level; now it climbs with pay. Seven in eight still travel to work, and the commute that shrank is the one to Manhattan.
In 2026 about a quarter of employed New Yorkers at work in a given week work from home for at least part of it and about one in ten for all of it, not detectably different from 2025, by the monthly survey behind the unemployment rate. The census, whose latest file is for 2024, counts one worker in eight usually at home, about 510,000 people, against fewer than one in twenty before the pandemic; the share peaked in 2021 and had all but levelled off by 2024. Who works from home now is not random. Working from home used to look the same at every pay level, and it now climbs with pay, with a degree, and from the Bronx to Manhattan, a gradient that largely follows which jobs people hold. In the office-based industries one worker in five is at home and four in five still travel, though the subway carries fewer of them, and about 300,000 fewer people from the city and its nearby suburbs travel to a Manhattan job than in 2019. The MTA's turnstile counts to September 2026 are consistent with an office week concentrated on Tuesday to Thursday.
The hour-long commute in New York is a matter of address and vehicle far more than pay. A quarter of the city's commuters spend an hour or more each way, mostly subway and bus riders from the outer boroughs; about half the racial gap remains after adjusting for where people live, travel and work; the pattern has held since 1990, and nothing in the MTA's 2026 figures says the trip got quicker.
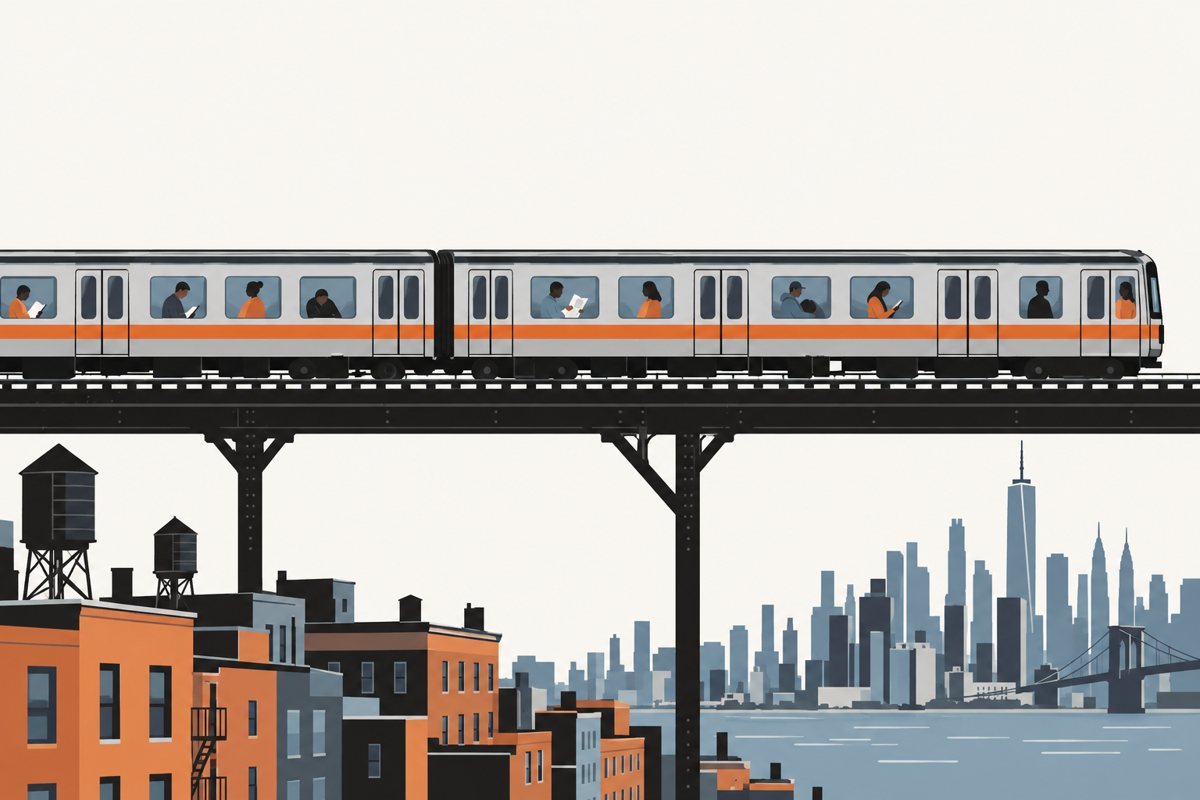
New York has the longest commute of any big American city, and one commuter in four, about 900,000 people, travels an hour or more each way. The census microdata behind that number says who they are. The hour-plus trip is a place and a mode: a subway or bus ride from the outer boroughs, where half of Bronx subway riders are over the hour while drivers look alike in every borough. Below $150,000 a year, pay barely distinguishes the hour-plus commuter. Race does: Black commuters are over the hour far more often than white commuters, and about half of that gap remains after adjusting for where people live, how they travel, where they work and what they earn. Thirty-four years of the same question show the pattern outlasting the city around it. The MTA's own figures carry it into 2026: weekday subway ridership at three quarters of its 2019 level through September, and, through August, buses running at the speed they ran in 2019 and a subway trip about as likely to run late as it was then.
A six-figure income doesn't settle whether a New York household can afford its rent. About 93,000 six-figure renter households pay 30% or more of their income in rent; the most exposed are roommates pooling smaller incomes and recent movers. Count tax and a basic budget, and families with children join them, most from under the official line. Since 2024, rents have outpaced pay.
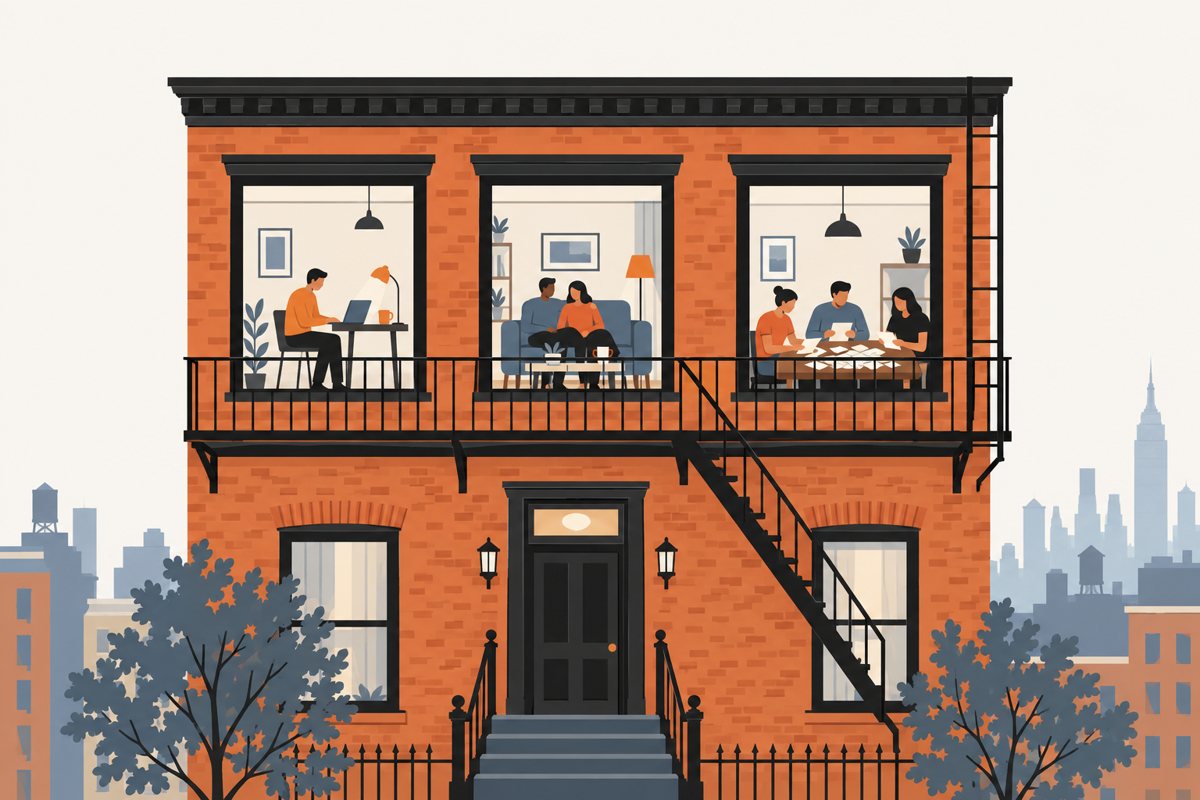
A six-figure income doesn't settle whether a New York household can afford its rent. Across the latest census files, about 93,000 renter households earn $100,000 or more and still pay at least 30% of their income in rent, one in twelve of the city's rent-burdened renters. Who are they? The microdata says the answer turns on three things a salary doesn't show, and the first is that a six-figure household is often several smaller incomes added together. The other two, and the divide that opens for families once tax and child care are counted, are inside. Rents have outpaced pay since 2024, and from October a freeze holds rent-stabilised renewals while market leases run on. Which of the city's hundred-thousand-dollar households is actually squeezed?
Reproducible. The numbers in an article are computed by its
code from its companion dataset — not typed in.
Sourced. Every figure quoted from elsewhere links to the table
it came from, with its vintage and margin of error.
Labelled. Each number says whether it was measured in one
survey, estimated across two, or assumed — and every chart says what it cannot
show.
Interactive. The charts can be filtered and re-cut in the
browser; every combination they can reach was computed in advance from the
data, with its margin.