
Call 911 for someone who has collapsed, and what follows has a fixed order. A call-taker answers and codes the emergency. A dispatcher assigns an ambulance. The crew drives to the address. Every one of those steps is timed, and in the year to June 2026 the sum of them got much longer.
The city said so itself. The Mayor’s Management Report, released in September, puts the average ambulance response to life-threatening emergencies at 10:32 in fiscal 2026, up by more than a minute and a half on the year before. It does not say where the extra minute and three-quarters went, and that is the useful question, because each step has a different fix. A slower phone line, more calls, a shortage of ambulances and slower streets would each call for something else.
The FDNY’s own dispatch records show where the time appears: before and after an ambulance is assigned, not in the 911 call. They also show a complication. About one call in eight in the headline figure began at a lower priority and is timed from the original call, and those calls amplify the rise. For calls life-threatening from the start, response rose by about a minute, most of it after assignment, while ambulance capacity fell and calls did not rise. Let’s take the records step by step. Every chart is interactive, and the data and code are at the end.
Response slowed by a minute and three-quarters, to the slowest since 1988
First, a check that the records tell the same story as the report. Summing the dispatch file the way the report counts, calls whose final coding is life-threatening, timed from the moment the call is created, gives 10:37 for fiscal 2026, five seconds off the report’s figure, and the same rise to within two seconds. Every year back to 2022 lands within five seconds.
Set against thirty years, fiscal 2026 stands out further. In fiscal 1996, the year the city merged its Emergency Medical Service into the Fire Department, the city’s figure was 8:58. Over the next sixteen years it fell by two and a half minutes, to its low in fiscal 2012, and through fiscal 2021 it stayed under seven and three-quarter minutes. Since then it has risen five years running.
The rise in fiscal 2026 was the largest in the city’s figures, which go back to fiscal 1988, more than two and a half times the largest before it, and it made fiscal 2026 the slowest year since 1988, the first year the city’s reports treat as comparable. Before 2005 the series rests on the city’s printed figures, but from 2006, where the dispatch file can check them, the two agree within five seconds every year.
The slowest year since 1988
Administrative Counts from an agency’s own records: the calls, inspections, trips or transactions it logs. They carry no sampling margin, but they count events rather than people, and they can be cut only by what the agency records about each one.Average ambulance response to life-threatening calls, fiscal years 1988 to 2026, as the city reported it each year
The interactive chart needs JavaScript; its numbers are in the table below.
How to read this, and what it cannot show
The city’s yearly figure from its annual Mayor’s Management Report, chained from report to report. A second line, rebuilt from the dispatch file from 2006, runs underneath it and nearly coincides. Hover for any year’s figure.
The city's figure is the Mayor's Management Report's average response time to life-threatening medical emergencies by ambulance units, chained from report to report (the five-year windows overlap up to fiscal 2016; the 2016/2017 and 2021/2022 joins are checked against the dispatch-file rebuild): fiscal 1988-1999 from the fiscal 1999 report's chart, 2000-2001 from the fiscal 2001 and 2004 reports (which bridge the indicator's change of name), 2002 from the fiscal 2006 report, 2003-2012 from the city's indicator table, 2013-2016 from the fiscal 2016 report, 2017-2021 from the fiscal 2021 report and 2022-2026 from the fiscal 2026 report. Where a later print revised a year by a second, the later print is used. The fiscal 1999 report calls the figures comparable from fiscal 1988; before 2005 there are no public call records to check them against. The rebuild sums the dispatch file the same way and stays within five seconds of the city's figure in every year from 2006.
The numbers behind this chart
| Group | 1988 | 1989 | 1990 | 1991 | 1992 | 1993 | 1994 | 1995 | 1996 | 1997 | 1998 | 1999 | 2000 | 2001 | 2002 | 2003 | 2004 | 2005 | 2006 | 2007 | 2008 | 2009 | 2010 | 2011 | 2012 | 2013 | 2014 | 2015 | 2016 | 2017 | 2018 | 2019 | 2020 | 2021 | 2022 | 2023 | 2024 | 2025 | 2026 |
|---|---|---|---|---|---|---|---|---|---|---|---|---|---|---|---|---|---|---|---|---|---|---|---|---|---|---|---|---|---|---|---|---|---|---|---|---|---|---|---|
| Rebuilt from the dispatch file | – | – | – | – | – | – | – | – | – | – | – | – | – | – | – | – | – | – | 6:43 | 6:36 | 6:39 | 6:41 | 6:42 | 7:01 | 6:26 | 6:45 | 6:47 | 7:04 | 7:03 | 6:47 | 6:55 | 7:24 | 7:39 | 6:47 | 7:29 | 8:01 | 8:17 | 8:52 | 10:37 |
| The city's annual report | 11:04 | 10:03 | 8:56 | 8:39 | 8:21 | 8:36 | 8:45 | 8:46 | 8:58 | 8:14 | 7:54 | 7:35 | 7:48 | 7:04 | 6:52 | 6:55 | 7:01 | 6:47 | 6:42 | 6:36 | 6:39 | 6:40 | 6:41 | 7:00 | 6:25 | 6:45 | 6:46 | 7:04 | 7:03 | 6:46 | 6:55 | 7:23 | 7:37 | 6:46 | 7:26 | 7:59 | 8:16 | 8:49 | 10:32 |
The break itself is recent. From December 2025, six of the next seven months rose on the same month a year earlier by more than any month from 2017 to mid-2025, Covid aside, and the latest month published, June 2026, averaged 12:22.
Every month of ambulance response since 2005
Administrative Counts from an agency’s own records: the calls, inspections, trips or transactions it logs. They carry no sampling margin, but they count events rather than people, and they can be cut only by what the agency records about each one.Average time from the creation of a call ultimately classed as life-threatening to the first ambulance on scene, monthly, January 2005 to June 2026
The interactive chart needs JavaScript; its numbers are in the table below.
How to read this, and what it cannot show
The thin line is each month’s average time from a call’s creation to the first ambulance on scene; the thick line averages the latest twelve months, which removes the seasonal swing. The labelled points are placed by rule. Hover anywhere for that month’s figure.
Mean of dispatch (creation to first assignment) plus travel (first assignment to arrival) for calls whose final segment is 1 to 3, the Mayor's Management Report's definition. The thick line is the 12-month average, which removes seasonal swings. Annotations are placed by rule.
The numbers behind this chart
| Annotation | Month | Response |
|---|---|---|
| The first Covid wave | March 2020 | 10:09 |
| The break | December 2025 | 11:44 |
| The latest month | June 2026 | 12:22 |
The extra time is before and after assignment, not on the phone
So where did the minute and three-quarters go? Not into the call itself. The time from the first ring to the creation of the ambulance job rose by about five seconds, tiny beside the rest of the increase. The rest split almost evenly: the stretch from the job’s creation to the first ambulance assigned rose by 51 seconds, and the trip from assignment to arrival by 54.
Where the minutes are spent
Administrative Counts from an agency’s own records: the calls, inspections, trips or transactions it logs. They carry no sampling margin, but they count events rather than people, and they can be cut only by what the agency records about each one.Life-threatening calls, fiscal years 2017 to 2026, average minutes:seconds
The interactive chart needs JavaScript; its numbers are in the table below.
How to read this, and what it cannot show
Response is creation to assignment (dispatch) plus assignment to arrival (travel). A unit sent from farther away, or reassigned on the way, shows up in the second stretch. Call-taking comes from the city’s 911 file, which times the same class of calls from the first ring.
Response, dispatch and travel from the dispatch file; call-taking (the 911 call to the creation of the EMS job) from the weekly 911 end-to-end file, which times the same calls from the first ring. Travel starts at the first assignment, so a unit sent from farther away counts as travel.
The numbers behind this chart
| Group | 2017 | 2018 | 2019 | 2020 | 2021 | 2022 | 2023 | 2024 | 2025 | 2026 |
|---|---|---|---|---|---|---|---|---|---|---|
| Response (dispatch plus travel) | 6:47 | 6:55 | 7:24 | 7:39 | 6:47 | 7:29 | 8:01 | 8:17 | 8:52 | 10:37 |
| First assignment to arrival (travel) | 6:16 | 6:23 | 6:42 | 6:47 | 6:20 | 6:52 | 7:13 | 7:11 | 7:39 | 8:34 |
| 911 call to job creation | 2:05 | 1:58 | 2:25 | 2:34 | 2:40 | 2:41 | 2:35 | 2:30 | 2:25 | 2:30 |
| Creation to first assignment (dispatch) | 0:31 | 0:32 | 0:42 | 0:52 | 0:27 | 0:37 | 0:48 | 1:06 | 1:12 | 2:03 |
Neither stretch is quite what its usual name suggests. Dispatch is not all waiting for a free ambulance: choosing and assigning one takes time even when one is free, and only the calls the file flags as held are recorded as unable to get a unit at once. Travel is not driving speed either. It starts the moment the first unit is assigned, so a unit sent from farther away, or a reassignment on the way, lands in travel, and the file holds no unit locations to tell those apart from slower streets.
Fire engines are a useful benchmark, though not a control: they are stationed and sent differently from ambulances. On life-threatening medical calls, the report shows their dispatch and travel rose by 11 seconds, against more than a minute and a half for ambulances. A citywide traffic slowdown would have slowed the engines too, so it is hard to square with that gap, though these aggregate data cannot measure traffic’s share.
Calls urgent from the start slowed by about a minute, mostly after assignment
But the headline figure mixes two kinds of call. Most were coded life-threatening from the first. About one in eight began at a lower priority and was upgraded later, and the report times those from the original call. That counts the whole wait from the moment the call was entered, including time spent queued at a lower priority before anyone knew the call was life-threatening, and the public file does not record when the upgrade happened.
Set the upgraded calls aside and the rise shrinks but stays large. Calls life-threatening from the start took 56 seconds longer to reach in fiscal 2026, most of it after assignment: their wait for an assignment rose by under ten seconds.
So the half of the headline rise that sits before assignment comes mostly from upgraded calls. In a shift-share decomposition they account for 64 of the 105 seconds, and four-fifths of their six-minute rise came before an ambulance was assigned. How much of that was a queue for an ambulance, and how much was time at a lower priority, the public file cannot say.
Which calls got slower
Administrative Counts from an agency’s own records: the calls, inspections, trips or transactions it logs. They carry no sampling margin, but they count events rather than people, and they can be cut only by what the agency records about each one.Average response to life-threatening calls by kind of call, fiscal years 2024 to 2026
The interactive chart needs JavaScript; its numbers are in the table below.
How to read this, and what it cannot show
Average response by kind of call, fiscal 2024 to 2026. Ordinary calls were life-threatening from their first coding and were not held; the held row is calls also urgent from the start but held for a unit; upgraded calls are timed from their original creation.
Ordinary calls were life-threatening from their first coding and were not held; held calls here were also life-threatening from the start but flagged as held because no unit could be assigned at once (held calls that were also upgraded are with the upgraded); upgraded calls began at a lower priority and are timed from their original creation, as the Mayor's Management Report times them.
The numbers behind this chart
| Group | Fiscal 2024 | Fiscal 2025 | Fiscal 2026 |
|---|---|---|---|
| Life-threatening from the start, not held | 7:15 | 7:44 | 8:33 |
| Life-threatening from the start, held for a unit | 10:39 | 10:23 | 11:50 |
| Upgraded to life-threatening later | 15:57 | 17:40 | 24:05 |
| All life-threatening calls | 8:17 | 8:52 | 10:37 |
Held calls are the cleaner evidence of a queue, because the flag says directly that no unit could be assigned at once. Their share of life-threatening calls rose by two thirds, to 11.5%, and held calls urgent from the start took about a minute and a half longer to reach than a year before.
The ordinary call, urgent from the start and never held, slowed by 49 seconds, nine-tenths of it after assignment. The evidence points toward less available capacity: when the nearest ambulance is already out, the next one assigned may have farther to come, and reassignments add time too. The records cannot separate those, because they don’t say where each ambulance started.
The city’s weekly 911 medians tell a similar story. Averaged across the year, weighted by incidents, the median wait from the handoff to EMS until an assignment barely moved, while the median trip rose by about three-quarters of a minute. The slower trip reached the typical call; the longer average wait for an assignment did not.
Fewer ambulance hours for about the same number of calls
Therefore the next question is supply. Ambulance in-service hours, the time units are available or on an assignment, fell 5.4% in fiscal 2026, or 463 hours a day. The report gives the reasons: staffing fell, and fell more than usual as many emergency medical technicians were called off a promotion list to become firefighters, and eleven hospital ambulances left the city’s emergency system.
amNY reported that the FDNY attributed the rise to “several factors including fewer ambulances on the street and record-breaking call volume.” The report’s own fiscal 2026 ambulance series does not show record volume: all ambulance incidents and life-threatening incidents both fell slightly. The FDNY may have been referring to a different 911 series, shorter peak periods or another span of time.
Fewer ambulance hours, not more calls
Administrative Counts from an agency’s own records: the calls, inspections, trips or transactions it logs. They carry no sampling margin, but they count events rather than people, and they can be cut only by what the agency records about each one.Index, fiscal 2022 = 100, fiscal years 2022 to 2026
The interactive chart needs JavaScript; its numbers are in the table below.
How to read this, and what it cannot show
Index, fiscal 2022 = 100. In-service hours and all ambulance incidents are quoted from the Mayor’s Management Report; calls per capacity divides one by the other; response time comes from the dispatch file. Hospital turnaround, not shown, was flat. The chart shows what moved together; it does not show what caused what.
In-service hours are the hours a unit is available or on an assignment, not time spent driving. Hours and incidents (all ambulance incidents) are quoted from the Mayor's Management Report; calls per capacity divides those incidents by the year's in-service hours (the hours a day times the days in the fiscal year, 366 in fiscal 2024); response time is from the dispatch file. Hospital turnaround, also from the report, was flat (40:40 to 40:25) and is left off. The chart shows what moved together; it does not show what caused what.
The numbers behind this chart
| Group | 2022 | 2023 | 2024 | 2025 | 2026 |
|---|---|---|---|---|---|
| Ambulance in-service hours per day (MMR) | 100.0 | 97.7 | 97.3 | 96.4 | 91.2 |
| All ambulance incidents (MMR) | 100.0 | 105.3 | 107.3 | 105.5 | 104.8 |
| All ambulance incidents relative to in-service hours (MMR) | 100.0 | 107.8 | 110.0 | 109.4 | 114.9 |
| Response time | 100.0 | 107.2 | 110.8 | 118.4 | 141.8 |
Hospital turnaround did not rise; it stayed at about forty minutes. Set the calls against the hours and each unit of ambulance capacity had about 5% more calls to handle than a year before, and about 4% more life-threatening ones. Together with the jump in held calls, that is converging evidence that available capacity got tighter, though it does not prove what caused the slowdown.
Every borough slowed, and the summer of 2026 was slower still
Every borough slowed, Queens and the Bronx the most, and the Bronx remains the slowest at 12:16. The questions at the end let you look at any borough by dispatch, travel or the share of calls held.
Every borough slowed, Queens and the Bronx most
Administrative Counts from an agency’s own records: the calls, inspections, trips or transactions it logs. They carry no sampling margin, but they count events rather than people, and they can be cut only by what the agency records about each one.Average ambulance response to life-threatening calls, fiscal years 2024 to 2026
The interactive chart needs JavaScript; its numbers are in the table below.
How to read this, and what it cannot show
Average ambulance response to life-threatening calls by borough of the incident, fiscal 2024 to 2026. A few incidents carry no borough and count in the whole-city figure only.
Borough of the incident. In fiscal 2024 to 2026 every incident in these averages has a borough, so the five boroughs together are the whole city.
The numbers behind this chart
| Group | Fiscal 2024 | Fiscal 2025 | Fiscal 2026 |
|---|---|---|---|
| Bronx | 8:50 | 10:12 | 12:16 |
| Brooklyn | 7:52 | 7:57 | 9:02 |
| Manhattan | 8:36 | 9:15 | 10:58 |
| Queens | 8:08 | 8:30 | 11:00 |
| Staten Island | 7:20 | 7:38 | 8:48 |
| Whole city | 8:17 | 8:52 | 10:37 |
It has not eased. Measured from the first ring, the eight weeks from late June to mid-August 2026 averaged 14:12, nearly two and a half minutes slower than the same weeks of 2025. They are the latest weeks in the city’s published file but one: the last looks incomplete, and counting it barely changes the gap.
So the minute and three-quarters is not on the phone, and it has taken ambulance response back past where it stood thirty years ago. Part of it is how the headline counts upgraded calls; for calls urgent from the start, the rise is about a minute, most of it after an ambulance is assigned. Around that sits converging evidence of tighter capacity: fewer ambulance hours for slightly fewer calls, and a sharp rise in calls that could not get a unit at once. The records cannot say exactly why trips lengthened, and the engines’ small rise is hard to square with slower streets. Faster call-taking would barely address what changed in fiscal 2026. The things to watch are ambulance availability, the delays before assignment, and the time units spend unavailable, at hospitals included. The next report, and the city’s monthly dispatch file when it resumes after June, will show whether the queue is still lengthening.
Questions this raises
How well do these numbers match the city’s own?
Closely. The dispatch file, summed the way the Mayor’s Management Report counts (final segment 1 to 3, timed from the call’s creation, valid times only), gives 7:29, 8:01, 8:17, 8:52 and 10:37 for fiscal 2022 to 2026 against the report’s 7:26, 7:59, 8:16, 8:49 and 10:32: within one to five seconds every year, and a rise of 1:45 against the report’s 1:43. Counts match too: 610,791 life-threatening calls in fiscal 2026 against the report’s 610,771. Two years differ by about 1,700 calls in opposite directions (fiscal 2023 and 2025), which the published data do not explain. The weekly 911 file reproduces the report’s end-to-end figures exactly: 11:21 and 13:09.
Administrative Counts from an agency’s own records: the calls, inspections, trips or transactions it logs. They carry no sampling margin, but they count events rather than people, and they can be cut only by what the agency records about each one.
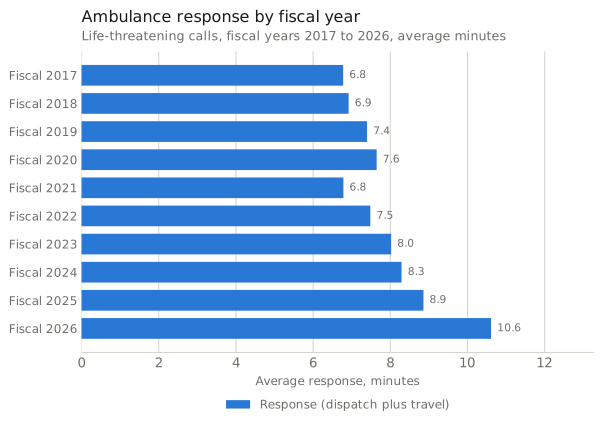
How to read this, and what it cannot show
One bar per fiscal year, in decimal minutes (10.6 minutes is 10:36). Means of the dispatch file’s monthly sums.
How far back can the city’s figure be compared?
To fiscal 1988. The city’s annual Mayor’s Management Report has printed ambulance response to life-threatening calls every year since then, and each report reprints earlier years, so the series can be chained across its changes of name. The fiscal 1999 report charts 1988 to 1999 and says “comparable measurements began in Fiscal 1988”; the fiscal 2004 report carries fiscal 2000 and 2001 unchanged under the newer name, “average response time to life-threatening medical emergencies by ambulance units”. The reports later added an end-to-end figure from the 911 call, starting with fiscal 2013, and now label this one “FDNY dispatch and travel time only”. Where a later report revised a year, it was by a second (fiscal 2003 to 2005), and the later print is used.
Before 2005 there are no public call records to check the figures against. From fiscal 2006 the dispatch file can, and it lands within five seconds of the city’s figure every year. The tools changed over those decades too: the FDNY fitted every ambulance with an automatic vehicle locator between November 2005 and the end of fiscal 2006, for example. So a difference of a few seconds across decades says little; the swings of minutes are what the series shows. The figure was 11:04 in fiscal 1988 and 10:03 in 1989, then between 8:21 and 8:58 from 1990 to 1996, the year of the merger.
Can I look at my own borough, or at dispatch and travel separately?
Yes. The chart below shows every borough from fiscal 2017, for response, dispatch, travel or the share of calls held, and for all life-threatening calls, those urgent from the start, or those upgraded later.
Cut the response times your own way
Administrative Counts from an agency’s own records: the calls, inspections, trips or transactions it logs. They carry no sampling margin, but they count events rather than people, and they can be cut only by what the agency records about each one.By borough, fiscal years 2017 to 2026: pick a measure and a kind of call
The interactive chart needs JavaScript; its numbers are in the table below.
How to read this, and what it cannot show
Means from the dispatch file’s monthly sums, fiscal years ending in June. Upgraded calls are about one in eight, so their borough lines are noisier.
Means from the dispatch file's monthly sums, fiscal years ending in June. Upgraded calls are about one in eight, so their borough lines are noisier.
The numbers behind this chart
| Group | 2017 | 2018 | 2019 | 2020 | 2021 | 2022 | 2023 | 2024 | 2025 | 2026 |
|---|---|---|---|---|---|---|---|---|---|---|
| Bronx | 6:42 | 7:02 | 7:44 | 8:26 | 6:57 | 7:48 | 8:21 | 8:50 | 10:12 | 12:16 |
| Brooklyn | 6:54 | 6:56 | 7:20 | 7:21 | 6:41 | 7:27 | 7:51 | 7:52 | 7:57 | 9:02 |
| Manhattan | 6:43 | 6:53 | 7:26 | 7:12 | 6:31 | 7:03 | 7:55 | 8:36 | 9:15 | 10:58 |
| Queens | 6:54 | 6:54 | 7:14 | 7:50 | 7:00 | 7:39 | 8:10 | 8:08 | 8:30 | 11:00 |
| Staten Island | 6:16 | 6:29 | 6:31 | 6:51 | 6:54 | 7:35 | 7:25 | 7:20 | 7:38 | 8:48 |
| Whole city | 6:47 | 6:55 | 7:24 | 7:39 | 6:47 | 7:29 | 8:01 | 8:17 | 8:52 | 10:37 |
Isn’t this just traffic, or the congestion toll?
Nothing here points to a citywide traffic slowdown, but these aggregate data cannot estimate traffic’s contribution. Fire engines answering life-threatening medical calls slowed by 11 seconds in fiscal 2026 (5:52 to 6:03), and at structural fires by three, against 1:43 for ambulances on the same measure. Engines are stationed and sent differently from ambulances, so they are a benchmark rather than a control. Manhattan, which contains the congestion zone, had the smallest rise in ambulance travel of the four large boroughs (40 seconds, against 94 in Queens).
A working paper from the National Bureau of Economic Research (not yet peer-reviewed) compares EMS incidents on either side of the congestion zone’s boundary. It estimates that the toll cut total EMS travel by 63 to 70 seconds, but almost all of that came on the trip from the scene to the hospital (54 to 59 seconds). Its estimate for the trip to the patient, the leg inside the travel time here, is 7 to 9 seconds, and the authors call it imprecise. The dispatch file cannot isolate the zone, so we don’t estimate any effect of the toll here; these borough-level figures give no evidence that the toll slowed ambulances.
Did call volume rise?
Not for ambulances. In the report’s own table, life-threatening incidents fell 1.6% in fiscal 2026 and all ambulance incidents 0.6%, and fiscal 2024 was busier on both, at 633,361 and 1,644,446. Patient transports fell 8%. If “record call volume” refers to all 911 calls or to fire calls, those are other series. The dispatch file’s own counts fall a little more (1.8% and 0.9%), because its fiscal 2025 totals sit above the report’s, by about 1,700 life-threatening calls and about 4,500 calls in all.
The report also says 9:13 and 7:28. Which number is right?
All three, for different questions. 10:32 is ambulances alone, timed from the original call. 9:13 is the first unit of either kind, ambulance or fire company, so it is shorter because engines often arrive first. 7:28 is the same combined figure timed from the moment an upgraded call was upgraded rather than from its original creation. We reproduce the ambulance-only figure; the combined ones need fire-company times and upgrade times that the public dispatch file does not carry, so we quote them and don’t recompute them.
Why time upgraded calls from the original call?
Because that is the whole wait from the moment the call was entered, and the report counts it that way. The cost is that it includes time before anyone knew the call was life-threatening, when it was queued behind calls coded as more urgent. Since upgraded calls carry 64 of the 105 seconds in the shift-share decomposition, the choice matters. The report shows how much for ambulances and fire companies together: timed from the call’s creation, that combined figure rose from 7:45 to 9:13; timed from the moment of upgrade, from 6:46 to 7:28. The public dispatch file has no upgrade times, so we cannot make the second measure for ambulances alone.
Is a rise this size unusual, or noise?
Unusual. From January 2017 to June 2025, leaving out the Covid months from March 2020 to June 2021, a month’s average response moved on the same month a year earlier by 22 seconds on average, with a standard deviation of 27 and a largest rise of 98. Six of the twelve months of fiscal 2026 rose by more than that largest, starting in December 2025, and the year’s rise of 105 seconds is two and a half times the largest annual rise in the dispatch file back to fiscal 2006 (42 seconds, in fiscal 2022). In the city’s own figures, back to fiscal 1988, the largest rise before it was 40 seconds, also in fiscal 2022. The slowest single week in the 911 file is still the week of 23 March 2020, at the height of the first Covid wave.
What is “travel”, exactly, and what is “dispatch”?
Dispatch runs from the creation of the EMS job to the first ambulance assigned to it. For a held call it includes the time until a unit could be assigned; for other calls it is the time to choose and assign one. Travel runs from that first assignment to the first ambulance on scene. Because it starts at the first assignment, travel includes any reassignment (a unit sent, then diverted to a more urgent call, and replaced) and the distance of whichever unit was assigned. A longer travel time can therefore mean slower streets, a unit sent from farther away, or a reassignment; the data cannot tell them apart, which is why the fire-company benchmark matters.
Where this data goes quiet
Why ambulance hours fell: the report names staffing and hospital withdrawals, but the dispatch file records calls, not crews. Where each ambulance started, so distance and speed. Patient outcomes. Anything below the borough. Medians for the dispatch file: it holds sums and counts, so its times are averages, and the medians come only from the 911 file’s weekly figures. And July 2026 onward in the dispatch file, which the city had not yet published at the start of October.
Under the hood: data, definitions and the full results
The dispatch file. FDNY EMS Incident Dispatch Data (NYC Open Data 76xm-jjuj), every EMS incident since January 2005, summed on the city’s server by month. The main sums start in January 2016, by borough, initial and final severity segment, the validity flags and the held flag; a second query, life-threatening calls with valid times only, goes back to January 2005 for the long view, and the two agree to within a second wherever they overlap. Life-threatening means final segment 1 to 3, the report’s definition; the initial-segment definition gives a smaller rise (57 seconds), because it leaves out upgraded calls, and calls life-threatening by both codings rose 56 seconds. Times use only incidents the file flags as having valid response times; every such incident also carries a valid dispatch time and all three sums, so the split into dispatch and travel needs no further exclusion. Fiscal year t runs from July of year t−1 to June of year t. Every time is a mean: summed seconds over incidents.
The 911 file. 911 End-to-End Data (t7p9-n9dy), weekly from November 2013, averages and medians by agency and incident type; fiscal 2015 is the first full year used. The EMS life-threatening rows give call to arrival, call to job creation, and dispatch and travel in minutes; this file’s dispatch runs from the call-taker’s handoff to EMS until an assignment, so it includes EMS call-taking and runs longer than the dispatch file’s, which starts at job creation. A week’s fiscal year is set by its midpoint. Its medians are weekly medians, so their average approximates the typical call rather than measuring it. The latest week, starting 24 August 2026, holds about 8,600 incidents against about 10,500 in recent weeks and may be incomplete, so the summer comparison stops the week before; counting it, the gap would be 2:21 rather than 2:26.
Decomposition. The fiscal 2025 to 2026 rise splits between calls life-threatening from the start and calls upgraded later by a shift-share: each group’s change in average time at its average share, plus the change in its share at its average time. Calls from the start contribute 41 seconds, upgraded calls 64; the total is the 105 seconds of the headline.
The city’s long series. Fiscal 1988 to 2026 as the Mayor’s Management Reports printed it: the fiscal 1999 report’s chart for 1988 to 1999, the fiscal 2001 and 2004 reports for 2000 and 2001, the fiscal 2006 report for 2002, the city’s indicator table for 2003 to 2012, the fiscal 2016 report for 2013 to 2016, the fiscal 2021 report for 2017 to 2021 and the fiscal 2026 report for 2022 to 2026. Overlapping prints agree within a second, including across the indicator’s change of name. The fiscal 2016, 2021 and 2026 reports’ windows meet end to end rather than overlap; across those two joins, the line rebuilt from the dispatch file stays within three seconds of the city’s figure. Key years: 11:04 in fiscal 1988, 8:58 in 1996, 6:25 in 2012 (the low), 8:49 in 2025 and 10:32 in 2026.
The quoted figures. Every figure and sentence quoted here, from the Mayor’s Management Reports, the city’s indicator table, the working paper and amNY, is looked up in the saved copy of its source on each run of the script, and one that is not found stops the build. The load on ambulance capacity divides the report’s incidents (all, or life-threatening) by the year’s in-service hours: the report’s average hours a day times the days in the fiscal year, 366 in fiscal 2024 and 365 in the others.
The full results. Fiscal 2025 and 2026, life-threatening calls: incidents 622,152 and 610,791; response 8:52 and 10:37; dispatch 1:12 and 2:03; travel 7:39 and 8:34; held 6.9% and 11.5%; upgraded 10.4% and 12.1%. Calls life-threatening from the start 7:50 and 8:46, of which dispatch rose 8 seconds and travel 47. Ordinary calls (from the start, not held) 7:44 and 8:33, travel 7:09 and 7:53. Held calls urgent from the start 10:23 and 11:50; all held calls, including those also upgraded, 21:07 and 24:58. Upgraded calls 17:40 and 24:05, dispatch 6:19 and 11:31. By borough, fiscal 2026 and the change: the Bronx 12:16 (+2:04), Manhattan 10:58 (+1:43), Queens 11:00 (+2:30), Brooklyn 9:02 (+1:05), Staten Island 8:48 (+1:11). From the report: ambulance in-service hours per day 8,572 and 8,109; hospital turnaround 40:40 and 40:25; fire companies at life-threatening calls 5:52 and 6:03. From the 911 file: call to arrival 11:21 and 13:09; call to job creation 2:25 and 2:30; dispatch, from the handoff to EMS, 2:17 and 3:05 on average, 1:22 and 1:28 at the weekly median; travel 7:43 and 8:38 on average, 6:47 and 7:33 at the median.
Rerunning it. The analysis script reads the city files and the saved report and writes every figure, chart and file here. The companion dataset is the dispatch file’s monthly sums from January 2016, by borough and call flags, so any dispatch-file average from 2016 can be rebuilt as summed seconds over incidents. The city’s yearly figures from 1988, the yearly figures rebuilt from fiscal 2006 and every quote, with its page, are in the results file; the monthly series from 2005 is in the chart data, to a tenth of a second. The 911 figures come from the city’s weekly file, which the script reads as published. The build manifest names the page version the run was made for and the checksum of the script and of every file linked here.
Continue exploring New York

Twenty months of the toll
Twenty months in, fewer vehicles are entering Manhattan's toll zone than in its first year, but a count at the door is not a measure of congestion.

The hour-plus commute
The hour-long commute in New York is a matter of address and vehicle far more than pay.
- Explore this dataset: the data and the code behind every number above.
- All articles · Search · RSS
SparkyData Weekly
Once a week, one New York theme: what the public data says about it, and the week's new articles.
Free, weekly, and one click to leave. Your address is held by Buttondown, which sends it; see the privacy policy.
Sources
- Mayor's Office of Operations — Mayor's Management Report, Fiscal 2026, Fire Department chapter (Released 17 September 2026; the indicators table and narrative on pages 61-62) — Ambulance dispatch and travel to life-threatening medical emergencies 8:49 in fiscal 2025 and 10:32 in fiscal 2026; end-to-end from the 911 call 11:21 and 13:09; life-threatening incidents 620,467 and 610,771; all ambulance incidents 1,615,531 and 1,605,979; ambulance in-service hours per day 8,572 and 8,109; hospital turnaround 40:40 and 40:25; fire companies at life-threatening calls 5:52 and 6:03; combined ambulance and fire 7:45 and 9:13, and 7:28 from the moment of upgrade; 11 hospital ambulances withdrawn from the 911 system in fiscal 2026
- Mayor's Office of Operations — Mayor's Management Report archive: fiscal 1997 and 1999 summary volumes, fiscal 2001 volume I, fiscal 2006 report, and fiscal 2016 and 2021 Fire Department chapters (Released each September, 1997 to 2021; the city's figure for every fiscal year from 1988) — Ambulance response to life-threatening (Segment 1-3) calls: 11:04 in fiscal 1988 and 8:58 in fiscal 1996 (the fiscal 1999 chart, which calls the figures comparable from fiscal 1988), 7:48 in fiscal 2000 and 7:04 in 2001, 6:52 in 2002, 6:25 in 2012 and 6:46 to 7:37 in 2017-2021; the March 1996 merger of the Emergency Medical Service into the Fire Department; automatic vehicle locators fitted to ambulances from November 2005
- Mayor's Office of Operations — FY03 - FY12 MMR Agency Performance Indicators (NYC Open Data jhjm-vsp8) (Fiscal 2003 to 2012, as last printed) — Average response time to life-threatening medical emergencies by ambulance units, 6:55 in fiscal 2003 to 6:25 in fiscal 2012, with the one-second revisions later reports made to fiscal 2003-2005
- FDNY — EMS Incident Dispatch Data (NYC Open Data 76xm-jjuj) (January 2005 to June 2026, last updated by the city 15 July 2026; summed by month on the city's server (from January 2016 by borough and call flags, from January 2005 for life-threatening calls alone), retrieved 1 and 2 October 2026) — Life-threatening calls (final segment 1 to 3) 622,152 in fiscal 2025 and 610,791 in fiscal 2026; mean response 8:52 and 10:37; held calls 6.9% and 11.5%
- NYC Office of Technology and Innovation — 911 End-to-End Data (NYC Open Data t7p9-n9dy) (Weekly, November 2013 to the week of 24 August 2026, last updated by the city 10 September 2026; retrieved 1 October 2026) — EMS life-threatening calls, call to arrival 11:21 in fiscal 2025 and 13:09 in fiscal 2026; call to job creation 2:25 and 2:30
- Chikish, Colman, Dave, Humphreys, Santamaria and Winship — Congestion Pricing and Emergency Medical Service Response: Evidence from New York City, NBER Working Paper 35414 (Issued July 2026, revised August 2026; a working paper, not peer-reviewed) — Near the congestion zone's boundary, total EMS travel 63 to 70 seconds shorter: 7 to 9 seconds (imprecise) on the trip to the incident and 54 to 59 seconds on the trip from the incident to the hospital
- amNY — FDNY EMS life-threatening emergency response time climbs nearly 2 minutes as staffing and pay crisis deepens (21 September 2026) — Quotes the FDNY attributing the rise to "several factors including fewer ambulances on the street and record-breaking call volume"
How to cite
Reference
BibTeX
Quote the version: a correction bumps it, and the corrections log says what changed. Charts can be embedded from the “Embed this chart” link under each one.