
On 1 October a rent freeze took effect for New York’s rent-stabilized apartments, nearly a million homes whose yearly increases are set by the city’s Rent Guidelines Board. For leases starting from that day until next September, the board set no increase at all, on one-year and two-year leases alike.
Two facts about the people in those apartments are often set against each other: three in ten rent-stabilized households earn six figures, and many of them struggle to pay the rent they already have.
Here’s the short answer: both are true, and for the most part they describe different people. The freeze can’t tell them apart, and how its value splits depends on the yardstick: in dollars, the better-off get a little more than their share, because they pay more rent; against what households earn, it is worth far more to the poorest.
That matters because the board decides again every June, and a freeze can be judged in dollars or against income, with different answers. So let’s look at both.
We read the city’s 2023 Housing and Vacancy Survey, the latest, which interviewed about 3,200 households in rent-stabilized apartments, and set the freeze against the increases the board allowed the year before. It follows the households the survey found in stabilized apartments; new tenants who move into stabilized vacancies during the freeze’s year are covered by the order too, but aren’t in the survey. For the long view we read every order the board has issued, back to its first, for leases from 1968, and every Housing and Vacancy Survey since 1993. Every chart is interactive, and the data and code are at the end.
For the first time, both leases are frozen in full
The board has set the increases for stabilized apartments since its first order, for leases from 1968. In its early years they were large: most orders before 1990 allowed 6% or more on a one-year renewal. Since 2014, none has allowed more than 3.25% on a one-year renewal.
This is only the fourth time the board has frozen a one-year renewal, after 2015, 2016 and 2020, and the first time it has frozen both years of a two-year lease. In 2020 it froze only the first year.
Renewal increases have shrunk since the 1980s, to zero in 2026
Administrative Counts from an agency’s own records: the calls, inspections, trips or transactions it logs. They carry no sampling margin, but they count events rather than people, and they can be cut only by what the agency records about each one.Rent Guidelines Board renewal guidelines for rent-stabilized apartments, by the year the leases start, 1968 to 2026
The interactive chart needs JavaScript; its numbers are in the table below.
How to read this, and what it cannot show
One point per order, at the year its leases start, from the board’s own chart of its orders. Where an order split a rate, the chart shows the main one: for 2020’s and 2023’s two-year leases, the first year’s rate (in 2020, 0% and then 1%). Through 1980 the board’s year began in July; since 1981, in October.
One point per order, at the year its leases start. Through the 1980 order the board's year began in July; the first order covered two years (July 1968 to June 1970), and the 1980 order ran fifteen months, to September 1981. Where an order split a rate, the chart shows: the rate where the owner provides heat (1980, 1981, 2004 to 2006, 2008, 2009); 2% for 2012, which allowed 2% or $20, whichever was greater; 1.5% for 2021's one-year lease, which was 0% for its first six months; and, for 2020's and 2023's two-year leases, the first-year rate on the two-year line and the second-year rate as a separate dot (0% then 1% in 2020, 2.75% then 3.2% in 2023). Early orders added a stabilizer or fuel charges on top. The board's chart summarizes its orders and is not a substitute for them.
The numbers behind this chart
| Group | 1968 | 1970 | 1971 | 1972 | 1973 | 1974 | 1975 | 1976 | 1977 | 1978 | 1979 | 1980 | 1981 | 1982 | 1983 | 1984 | 1985 | 1986 | 1987 | 1988 | 1989 | 1990 | 1991 | 1992 | 1993 | 1994 | 1995 | 1996 | 1997 | 1998 | 1999 | 2000 | 2001 | 2002 | 2003 | 2004 | 2005 | 2006 | 2007 | 2008 | 2009 | 2010 | 2011 | 2012 | 2013 | 2014 | 2015 | 2016 | 2017 | 2018 | 2019 | 2020 | 2021 | 2022 | 2023 | 2024 | 2025 | 2026 |
|---|---|---|---|---|---|---|---|---|---|---|---|---|---|---|---|---|---|---|---|---|---|---|---|---|---|---|---|---|---|---|---|---|---|---|---|---|---|---|---|---|---|---|---|---|---|---|---|---|---|---|---|---|---|---|---|---|---|---|
| One-year renewal | 10% | 6% | 7% | 6% | 6.5% | 8.5% | 7.5% | 6.5% | 6.5% | 4.5% | 8.5% | 11% | 10% | 4% | 4% | 6% | 4% | 6% | 3% | 6% | 5.5% | 4.5% | 4% | 3% | 3% | 2% | 2% | 5% | 2% | 2% | 2% | 4% | 4% | 2% | 4.5% | 3.5% | 2.75% | 4.25% | 3% | 4.5% | 3% | 2.25% | 3.75% | 2% | 4% | 1% | 0% | 0% | 1.25% | 1.5% | 1.5% | 0% | 1.5% | 3.25% | 3% | 2.75% | 3% | 0% |
| Two-year renewal (first year where split) | 10% | 8% | 9% | 8% | 8.5% | 10.5% | 9.5% | 8% | 8.5% | 6.5% | 12% | 14% | 13% | 7% | 7% | 9% | 6.5% | 9% | 6.5% | 9% | 9% | 7% | 6.5% | 5% | 5% | 4% | 4% | 7% | 4% | 4% | 4% | 6% | 6% | 4% | 7.5% | 6.5% | 5.5% | 7.25% | 5.75% | 8.5% | 6% | 4.5% | 7.25% | 4% | 7.75% | 2.75% | 2% | 2% | 2% | 2.5% | 2.5% | 0% | 2.5% | 5% | 2.75% | 5.25% | 4.5% | 0% |
| Two-year renewal, second year, where the order split it | – | – | – | – | – | – | – | – | – | – | – | – | – | – | – | – | – | – | – | – | – | – | – | – | – | – | – | – | – | – | – | – | – | – | – | – | – | – | – | – | – | – | – | – | – | – | – | – | – | – | – | 1% | – | – | 3.2% | – | – | – |
What is the freeze worth? That depends on what the board would otherwise have done, which no one can observe. The simplest benchmark is last year’s increases repeated: 3% on a one-year renewal and 4.5% on a two-year one.
Against that, a household renewing under the freeze would typically have paid about $600 more a year at 2023 rents, about $50 a month: rent its owner won’t collect.
The benchmark is a generous one, though: in May the board’s own proposals topped out at 2% and 4%, and against those the typical saving would be about $430.
Rolling 2023 rents forward by the board’s increases since then puts the typical saving nearer $660, but 2026 rents themselves aren’t in the survey.
Not every stabilized household gets it, either. Carrying the 2023 lease pattern forward, the model puts about one in five households in the second year of a two-year lease during the freeze’s window; they renew only after it closes, under whatever the board decides next June.
Six figures and low income, mostly in different households
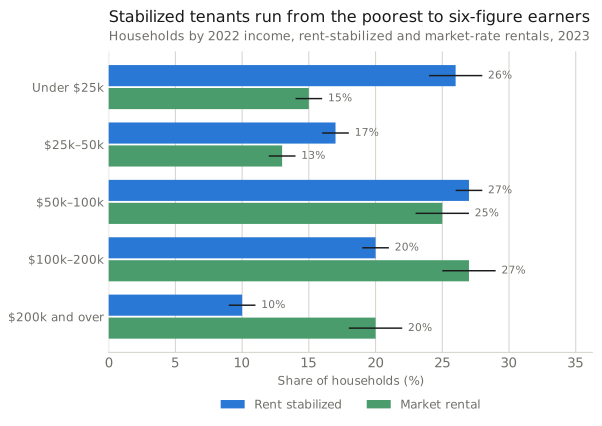
In the 2023 survey, about 960,000 households lived in rent-stabilized apartments, and the typical one earned about $60,000 a year.
Three in ten earned $100,000 or more: these are the six-figure households of the argument.
Yet two in three of those with any income were below 80% of HUD’s income limit for their household size, the line HUD generally calls low income: for one person, about $79,000 a year. Almost none of the low-income households earned six figures.
Many also struggle with the rent itself: 45% of those without a voucher paid more than 30% of their income in rent, more often than market renters did.
Market-rate renters have higher incomes: 47% of them earned six figures, against 30% of stabilized households.
Microdata estimate Tabulated directly from survey microdata, with no model in between: every variable in the chart is observed in the same record, so the relationship shown is measured rather than modelled. It is still an estimate from a sample, not a count of everyone, and the ticks are 90% margins from the survey’s replicate weights.
How to read this, and what it cannot show
One pair of bars per income band, with 90% margins of error. Public housing and other regulated rentals are not shown.
Six-figure households are more common in stabilized apartments than they were in the 1990s. Counting each survey’s incomes in 2022 dollars, so that a dollar buys the same in every year, between 19% and 23% earned that much in every survey from 1993 to 2014.
The surveys since have changed how they count, so they stand apart, but each has put the share above that range, at three in ten by 2023.
The savings follow the rent
A freeze spares a slice of each lease’s rent, so it spares more where the rent is higher; lease length matters a little too, since the two-year lease had the higher rate. Six-figure households pay higher rents on average, so they account for 39% of the modeled rent reduction while making up 31% of the households renewing under the freeze.
At the other end, households earning under $50,000 get 35% of the savings, less than their share of those households.
The savings tilt toward higher incomes, because their rents are higher
Computed Survey records combined with published parameters, such as a tax schedule or a budget standard. The tick is the survey margin on the computed quantity; the parameters carry their own uncertainty, and the FAQ gives the range under alternative assumptions.Each income group's share of the rent-stabilized households renewing under the freeze, and its share of their savings, 2023 survey
The interactive chart needs JavaScript; its numbers are in the table below.
How to read this, and what it cannot show
For each income group, the ring is its share of the stabilized households modelled to renew in the freeze’s window and the solid dot its share of their yearly savings, at 2023 rents, against last year’s increases repeated; a dot to the right of its ring means the group gets more than its share. A household’s saving is a year of its 2023 rent times the increase the freeze replaces, 3% or 4.5% by lease length. The shares barely change with the benchmark: scaling both rates together leaves them as they are. The city’s income fifths split every household in the city, owners included, into five equal groups.
Computed from the 2023 New York City Housing and Vacancy Survey, for the stabilized households modelled to renew between October 2026 and September 2027 (by their 2023 lease dates; a household whose two-year lease phase is unknown counts half). Each one's saving is 12 months of its 2023 contract rent times the increase the freeze replaces, against the benchmark of Order #57 repeated (3% for a one-year lease, 4.5% for a two-year lease). A group's share of the savings is its savings over all savings. Income is 2022 household income. The city's fifths split every household in the city, owners included, at $24,060, $60,000, $106,400 and $195,000. Hover for each share's 90% margin. A gap is coloured only when its own 90% margin, computed on each of the survey's replicate weights, excludes zero. These are sampling margins; they leave out the uncertainty of the model itself (who renews, and what rent and lease a household has in 2026).
The numbers behind this chart
| Group | Share of households | Share of the savings |
|---|---|---|
| Under $25k | 27% ± 1.8% | 21% ± 1.7% |
| $25k–50k | 16% ± 1.1% | 15% ± 1.2% |
| $50k–100k | 26% ± 1.3% | 26% ± 1.6% |
| $100k–200k | 21% ± 1.6% | 24% ± 2.2% |
| $200k and over | 9.9% ± 0.9% | 16% ± 1.8% |
| The poorest fifth of city households | 26% ± 1.8% | 20% ± 1.7% |
| Second fifth | 23% ± 1.5% | 21% ± 1.5% |
| Middle fifth | 23% ± 1.3% | 23% ± 1.6% |
| Fourth fifth | 18% ± 1.4% | 20% ± 1.9% |
| The richest fifth of city households | 10% ± 0.9% | 16% ± 1.8% |
Most of the money still goes to households earning under six figures: 61% of it.
Leaning toward six-figure households is nothing new. In every survey since 1993, they have paid more than their share of the stabilized rent, so a freeze would always have tilted their way.
Their slice has grown with their numbers. If every lease saved the same share of its rent, they would have got about a quarter of a freeze’s dollars in 1993, and 39% in 2023, on a survey that counts somewhat differently.
Six-figure households have always paid more than their share of the stabilized rent
Microdata estimate Tabulated directly from survey microdata, with no model in between: every variable in the chart is observed in the same record, so the relationship shown is measured rather than modelled. It is still an estimate from a sample, not a count of everyone, and the ticks are 90% margins from the survey’s replicate weights.Rent-stabilized households with incomes of $100,000 or more in 2022 dollars: their share of the households and of the rent, every survey from 1993 to 2023; the lines break where the survey changed how it counts, in 2017 and 2021
The interactive chart needs JavaScript; its numbers are in the table below.
How to read this, and what it cannot show
One line for six-figure households’ share of the stabilized households paying a cash rent, one for their share of that rent, one point per survey. Each survey’s incomes are for the year before it, converted to 2022 dollars. The lines break in 2017, when the survey began using state records of apartments registered as permanently exempt from stabilization, and in 2021, when it was redesigned. Ticks show 90% margins where the survey files allow them, from 2011.
Each survey's incomes are for the year before it (1992 for the 1993 survey, 2022 for 2023), converted to 2022 dollars with the New York-area consumer price index for all items: $100,000 in 2022 is about $48,400 of 1992 income. Both shares are among stabilized households paying a cash rent, and the rent is the monthly contract rent; if every lease saved the same share of its rent, a freeze's dollars would split as the rent does. The series starts in 1993, the first survey to estimate the incomes households did not report; the 1991 file leaves a quarter of them blank. The lines break twice: in 2017 the survey began using state records of about 62,000 apartments registered as permanently exempt from stabilization, which HPD says calls for caution in comparing the stabilized population with earlier years; in 2021 it was redesigned, with new income questions and more records behind stabilization status, and its first round asked about 2020, the first year of the pandemic. Compare points within a stretch: 1993 to 2014, 2017, and 2021 to 2023. Ticks are 90% margins from the replicate weights, from 2011; in those years the gap between the lines has a margin of at most 1.6 points. Each survey is a snapshot of whoever lived in stabilized apartments that year, not the same households over time.
The numbers behind this chart
| Group | 1993 survey (1992 incomes) | 1996 survey (1995 incomes) | 1999 survey (1998 incomes) | 2002 survey (2001 incomes) | 2005 survey (2004 incomes) | 2008 survey (2007 incomes) | 2011 survey (2010 incomes) | 2014 survey (2013 incomes) | 2016 (stabilization recoded) | 2017 survey (2016 incomes) | 2019 (survey redesigned) | 2021 survey (2020 incomes) | 2023 survey (2022 incomes) |
|---|---|---|---|---|---|---|---|---|---|---|---|---|---|
| Their share of the stabilized rent | 26% | 28% | 28% | 31% | 26% | 28% | 25% ± 1.6% | 29% ± 1.4% | – | 33% ± 1.7% | – | 34% ± 2.8% | 39% ± 2.0% |
| Their share of stabilized households | 19% | 20% | 21% | 23% | 20% | 21% | 20% ± 1.2% | 22% ± 1.0% | – | 24% ± 1.3% | – | 25% ± 1.9% | 30% ± 1.5% |
Our series starts with the 1993 survey, the first to estimate the incomes households didn’t report, as every survey since has. It breaks twice, where the survey changed how it counts: in 2017, when it began using state records of apartments registered as permanently exempt from stabilization, and in 2021, when it was redesigned with new questions about income.
But against income, it matters most to those with least
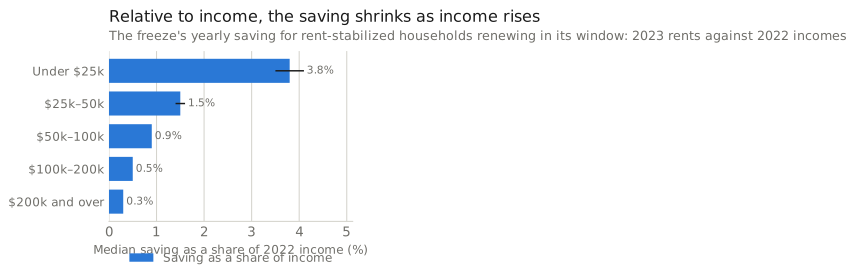
Set against what households earn, the order flips. For the poorest stabilized households, those under $25,000 who reported any income, the typical saving is about 4% of income; for the best-off, it is a fraction of a percent.
The reason is arithmetic. The saving is a slice of the rent, and for the poorest the rent is a large slice of income: among those without a voucher who reported any income, nine in ten paid more than 30% of it in rent.
Half of the poorest stabilized households get rental assistance, such as a housing voucher, from a program that pays all or part of their rent; for them, the household’s own saving may be smaller than the difference in rent, and the survey can’t show how it would be divided. Among households reporting no rental-assistance program, the typical saving is still 3.6% of income.
Computed Survey records combined with published parameters, such as a tax schedule or a budget standard. The tick is the survey margin on the computed quantity; the parameters carry their own uncertainty, and the FAQ gives the range under alternative assumptions.
How to read this, and what it cannot show
One bar per income band, the median within it among the households modelled to renew in the freeze’s window, at 2023 rents, against last year’s increases repeated, with 90% margins of error. The share of income is each household’s saving over its 2022 income; households with no or negative income, about one in six of those under $25,000, are left out of it.
A freeze can’t pick its tenants
So who gets the rent freeze? Every stabilized household that renews a lease before next October, and every new tenant of a stabilized vacancy in that time, rich and poor alike. Of the households the 2023 survey can follow, the model puts about four in five in the window, 77% to 81% depending on how leases without a standard term are counted. The board’s guidelines set increases by the length of the lease, not by what the tenant earns.
Measured in dollars, six-figure households get a little more than their share, because they pay higher rents, a lean the survey has recorded since 1993; measured against income, the poorest gain the most. Those are two different yardsticks, and next June the board will face both. Neither, on its own, says how it should set rents.
Questions this raises
What exactly did the board decide?
On 25 June 2026 the Rent Guidelines Board adopted Order #58: 0% for one-year and two-year leases starting between 1 October 2026 and 30 September 2027, and the same for stabilized lofts. Its hotel order, adopted the same day, set 0% for hotels, lodging houses, rooming houses and single-room-occupancy buildings. In its preliminary vote of 7 May, the board had proposed 0% to 2% for one-year leases and 0% to 4% for two-year leases; the year before, Order #57 allowed 3% and 4.5%.
The freeze applies at renewal: a tenant who renews in the order’s year gets no guideline increase for the whole lease, though other increases the law allows outside the guidelines can still apply. A tenant whose two-year lease began between 1 October 2025 and 30 September 2026 renews after that window closes, so this order doesn’t reach them; their next increase is set by next June’s order. The board’s chart notes that the same guidelines apply to vacant apartments rented during the order’s year, and that the 2019 rent law does not permit a separate vacancy allowance.
The order took effect on 1 October. A group of building owners has sued to void it and have the board vote again; the court had not ruled when the freeze took effect.
How much will I save?
If your stabilized lease renews between 1 October 2026 and 30 September 2027, you pay no guideline increase for the whole lease. Against last year’s increases, that is 3% of your rent on a one-year renewal and 4.5% on a two-year one: at $1,500 a month, the stabilized median, about $45 a month on a one-year lease and $67.50 on a two-year one.
If you receive rental assistance, your saving out of pocket may be smaller than the difference in rent; the survey can’t show how that difference would be divided between a household and the program that helps it.
What is the freeze worth in this model?
There is no observed price: any value needs a benchmark. For the households of 2023 modelled to renew during the order’s window, repeating last year’s 3% and 4.5% increases would have meant about $695 million more rent over the full terms of those leases (two years for a two-year lease), at 2023 rents, or about $528 million in their first year: rent that owners do not collect. That is a benchmark, not an estimate of what the board would otherwise have adopted, and not a citywide total: new tenants of apartments that fall vacant and are rented during the order’s year are outside it. At the top of its own preliminary ranges, 2% and 4%, the difference would be about $538 million, and at their middle, 1% and 2%, about $269 million. Whichever benchmark is used, six-figure households get about the same share of the savings, 39%.
About 15% of the savings fall to households reporting some rental assistance. The survey doesn’t show how an increase would have been split between such a household and the program that helps with its rent, so it can’t say how much of that part the tenants keep. What the freeze costs owners beyond the forgone rent, and what it does to buildings, is outside this data.
How did we put a value on the freeze?
Against a stated benchmark: the previous year’s increases repeated, 3% for a one-year lease and 4.5% for a two-year lease, applied to each household’s 2023 contract rent (the rent on the lease, before utilities) by the length of its lease. A household with no active lease, none reported, or one longer than two years, which the orders set no rate for, gets the one-year rate and a renewal in the window: 15% of households. The yearly saving at renewal is twelve months of rent times that rate: a median of $627 and a mean of $701 at 2023 rents across all stabilized households.
About 41% of stabilized households have a two-year lease, which renews every other year, so carrying the 2023 lease dates forward, about 81% of households renew in the freeze’s year; for them, the median saving is $603 a year. A year’s saving for each of them comes to about $528 million at 2023 rents. A two-year renewal keeps the freeze for both years of its lease, so over the leases the order covers the difference is about $695 million. If every stabilized lease renewed under it, a year’s saving would come to about $673 million.
The survey’s rents are from 2023. Rolling them forward mechanically by the board’s increases since then, 3%, 2.75% and 3% for one-year leases, about 9% in all, puts the median saving of a renewing household at about $657 and the order’s total at about $757 million; it ignores other increases and turnover, and 2026 rents are not observed. A different benchmark scales everything in proportion: a uniform 2% increase would have been worth about $379 million a year at 2023 rents if every lease renewed under it, a uniform 4.5% about $854 million.
Who counts as low income here?
The survey records each household’s income as a percentage of the Department of Housing and Urban Development’s fiscal 2023 income limit for the New York area, adjusted for household size, and HUD counts a household as low income at 80% of that limit or less. The ratio applies only to households with positive income: of those, 66% were low income. The survey sets apart the 5% of stabilized households that reported no or negative income; counting them as low income too, as the figures below do, gives 68% of all stabilized households.
Read back from the survey’s own ratios, 80% of the limit came to about $79,000 a year for one person and $113,000 for a family of four. So the two descriptions overlap little: 98% of the low-income households earned under $100,000, and 5% of the six-figure households counted as low income. At the other end, 18% of stabilized households had incomes above 120% of the limit, and 10% above 165%.
Does the split change with other choices?
Not in direction, and the gap itself is well outside its margin: six-figure households’ share of the rent reduction is 8.6 points above their share of the renewing households, with a 90% margin of 1.0 points computed on each of the survey’s replicate weights, and for households under $50,000 it is 8.0 points the other way. Across all 2023 stabilized households, each at its next renewal rather than only those renewing in this order’s window, six-figure households would get 38% of the savings while making up 30% of households. Treating the 15% without a standard lease differently barely moves the main share: imputing their lease length from the mix of known leases in their income band, or leaving them out, gives six-figure households 39.4% or 40.1% of the savings against 39.2%, and puts the share renewing in the window at 77% or 78% rather than 81%. Those households look like the rest: 30% of them earned six figures, as did 30% of the others.
With one rate for both lease lengths, six-figure households would get 40% of the savings rather than 39%, because they hold two-year leases less often: 35% of them do, against 43% of households under six figures. Leaving out the 20% of renewing households whose rent a program pays in whole or in part, they get 45% of the savings against 37% of households. Scaling both rates up or down together leaves every share unchanged.
In the city’s income fifths, which split every household in the city, owners included, into five equal groups, stabilized households in the richest fifth, above about $195,000, get 16% of the savings while making up 10% of the households renewing.
Where do six-figure stabilized tenants live?
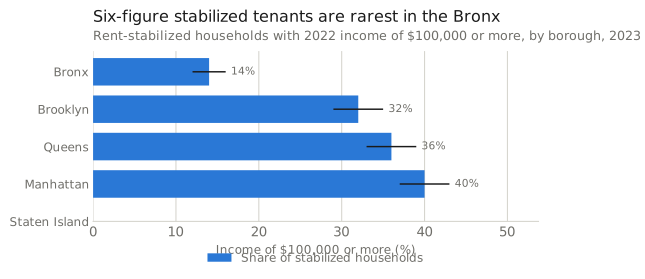
In every borough. They are rarest in the Bronx, 14% of stabilized households, and most common in Manhattan and Queens, 40% and 36%, a gap within the margin of error. Brooklyn sits between, at 32%. Staten Island has too few stabilized households in the survey, 27 records, to report.
Microdata estimate Tabulated directly from survey microdata, with no model in between: every variable in the chart is observed in the same record, so the relationship shown is measured rather than modelled. It is still an estimate from a sample, not a count of everyone, and the ticks are 90% margins from the survey’s replicate weights.
How to read this, and what it cannot show
One bar per borough with its 90% margin of error; Staten Island is not drawn.
How else do stabilized tenants differ from market renters?
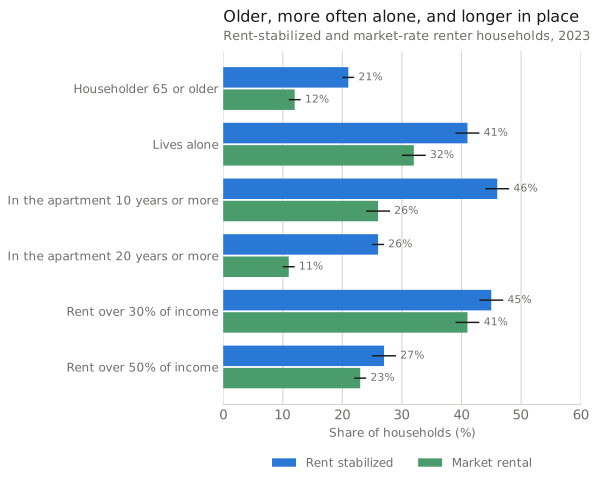
They are older and more often alone, and they have lived in place longer. In 2023, the householder was 65 or older in 21% of stabilized households, against 12% in market rentals; 41% lived alone, against 32%; 46% had been in the apartment ten years or more, against 26%, and 26% twenty years or more, against 11%. The median household had been in its apartment eight years, against three.
Among households without a voucher or public housing, they also more often pay a large share of income in rent: 45% paid more than 30% of their income, against 41% of market renters, and 27% more than half, against 23%. The survey counts a household that reports rent but no income as paying more than half.
Microdata estimate Tabulated directly from survey microdata, with no model in between: every variable in the chart is observed in the same record, so the relationship shown is measured rather than modelled. It is still an estimate from a sample, not a count of everyone, and the ticks are 90% margins from the survey’s replicate weights.
How to read this, and what it cannot show
Pairs of bars with 90% margins of error. Rent burden is 2023 contract rent against 2022 income among households without a Section 8 voucher or public housing, the board’s convention. The householder is the person who answered the survey.
How have incomes in stabilized apartments changed since the 1990s?
More slowly than in market-rate rentals, the private apartments with no rent regulation. Counting incomes in 2022 dollars, the share of market renters earning six figures went from 22% in the 1993 survey to 35% in 2014, while in stabilized apartments it went from 19% to 21%.
| Survey (incomes for) | Six figures, stabilized | Six figures, market rate | Median income, stabilized | Median income, market rate | Six-figure share of the stabilized rent |
|---|---|---|---|---|---|
| 1993 (1992) | 18.6% | 22.4% | $46,700 | $55,800 | 26.3% |
| 2014 (2013) | 21.4% | 34.5% | $49,000 | $70,000 | 28.8% |
| 2017 (2016) | 24.3% | 39.7% | $52,500 | $78,900 | 32.8% |
| 2021 (2020) | 25.5% | 34.5% | $51,500 | $69,000 | 34.3% |
| 2023 (2022) | 29.8% | 47.3% | $60,000 | $90,800 | 38.7% |
Incomes are in 2022 dollars. The survey changed how it counts twice: in 2017 it began using state records of apartments registered as permanently exempt from stabilization, and in 2021 it was redesigned, with new income questions, its first round asking about 2020, the first year of the pandemic. So compare rows within a stretch: 1993 with 2014, 2021 with 2023. The last column is among stabilized households paying a cash rent; it ran 5.5 to 9 points above their share of those households in every survey.
These are snapshots of whoever lived in each kind of apartment that year, not the same households: tenants moved in and out, apartments joined or left stabilization, and the market-rate stock grew by almost half between 1993 and 2014. In 2022 dollars, $100,000 is about $48,400 of 1992 income.
Does the survey match the published figures?
Yes. The survey files reproduce HPD’s published counts, 960,700 stabilized households, 1,119,000 market-rate and 167,700 in public housing, its medians, $1,500 for a stabilized contract rent and $60,000 for a stabilized household’s income, and its 1.41% vacancy rate. They also reproduce the board’s 30% of stabilized households at $100,000 or more against 47% of market renters, and its 28.8% median gross rent-to-income ratio for stabilized tenants without a voucher. HPD’s count of 996,600 stabilized units is higher than the households because it includes vacant units. For the long view, the older files reproduce the Census Bureau’s published income tables for 1999 to 2014, both the household counts and the medians, and the median incomes HPD reported from 1993 to 2023. These checks confirm the data and the survey’s estimates; they don’t test the model built on them, such as who renews in the window or the benchmark.
Where this data goes quiet
The survey is from 2023, the latest; incomes are for 2022 and rents for 2023, so every household fact here describes those years. No later count of who lives in stabilized apartments exists yet: the next survey, for 2026, run by HPD with the University of Michigan’s Institute for Social Research, has not published results. The dollars are computed at 2023 rents or rolled forward mechanically by the guidelines, not observed in 2026. Who renews in the freeze’s year is modelled, carrying the households of 2023 and the month each lease began forward; moves and lease changes since then are not in the data, and the tenants of apartments that fall vacant and are rented during the order’s year, who sign their leases under it too, are not in this survey. Nothing here measures what the freeze does to owners’ finances, buildings, rents for new tenants or who moves, and no comparison group exists to estimate it. The survey cannot show anything below the borough reliably, and Staten Island’s stabilized households are too few to report. The long view compares snapshots, not the same households, and its two stretches come from different questionnaires: through 2017, and from the 2021 redesign, whose first round asked about incomes in 2020, the first year of the pandemic.
Under the hood: data, definitions, methods and the full results
Households. The 2023 New York City Housing and Vacancy Survey public use files (HPD and the Census Bureau), 3,169 rent-stabilized households among 6,659 renter households interviewed. Regulation status is the survey’s own variable, built from administrative records (state rent registrations, HPD and HDC regulatory agreements, tax-benefit records and the Attorney General’s conversion filings) together with the interview. Income is the household’s 2022 income; rent is the 2023 contract rent, whoever pays it. Rental assistance is the survey’s RENTASSIST: a Section 8 voucher, a shelter allowance, CityFHEPS, SCRIE, DRIE or another program that pays all or part of the rent.
Margins. Every estimate uses the survey’s final weight, and every margin is a 90% margin of error from its 80 replicate weights, with medians recomputed on each replicate. A difference between groups is stated only when its interval excludes zero; a group’s share of the savings and its share of the households come from one sample, so their gap gets its own interval, computed on every replicate. These are sampling margins: they leave out the uncertainty of the model, such as who renews in the window.
The benchmark. Computed, against Order #57 repeated: twelve months of 2023 contract rent times 3% for a lease of a year or less or 4.5% for one over a year and up to two, the orders’ own terms (LEASE_LENGTH). Households with no active lease, none reported, or a lease longer than two years get the one-year rate and a renewal in the window; the checks above impute their lease length from their income band’s mix or leave them out. Whether a household with a two-year lease renews in the freeze’s year comes from the month its current lease began, carried forward in two-year steps; an unknown start counts half. Figures for renewing households weight each household by that share; the split of the savings by income (Figures 3 and 5 and the shares in the story) is among them, a year of each one’s saving. Shares of the savings are each group’s savings over all savings. Rolled-forward figures multiply by the one-year increases of Orders #55 to #57.
Low income. The survey’s HUDILFY23, each household’s income as a percentage of HUD’s FY2023 limit for its size, at 80 or less; it is not defined for households with no or negative income, which are reported separately. The dollar limits quoted are the median of income over that ratio among households of each size.
The orders. Every value on Figure 1 is checked against its row of the board’s chart of Orders #1 to #58, one-year before two-year, and the freeze, Order #57 and the preliminary ranges against the saved order pages. The first order covered two years of leases, from July 1968; through 1980 the board’s year began in July, and the 1980 order ran fifteen months, to September 1981. Where an order split a rate, the chart shows the rate where the owner provides heat (1980, 1981, 2004 to 2006, 2008, 2009), 2% for 2012 (2% or $20, whichever was greater), 1.5% for 2021’s one-year lease (0% for its first six months) and the first-year rate of 2020’s and 2023’s two-year leases. The board notes that its chart summarizes the orders and is not a substitute for them. Each published figure compared above is checked against the saved HPD and board reports, and the reports of the owners’ lawsuit against the saved news pages.
The long view. The occupied-unit public use files of every survey from 1993 to 2023 (2002 to 2008 from the Census Bureau’s 2008 longitudinal release), read at the positions of each year’s record layout: total household income for the year before the survey, monthly contract rent and the control-status recode, rent stabilized (codes 30 and 31 through 2017, 32 from 2021) or private unregulated, the market-rate group (code 80). Incomes are converted to 2022 dollars with the annual average consumer price index for New York-Newark-Jersey City, all items. The 1991 survey left 25.5% of renter incomes unreported, where later files estimate them, so the series starts in 1993. In 2017 the survey began using state records of about 62,000 apartments registered as permanently exempt from stabilization, after which HPD advises caution in comparing the stabilized population with earlier surveys; the 2021 redesign restructured the income questions, counted more kinds of income and drew stabilization status from more records. So 1993 to 2014, 2017, and 2021 to 2023 are separate stretches, and a change is stated only within one, when its interval excludes zero. Margins come from the replicate weights from 2011 and, before that, from the Census Bureau’s formula for a percentage with a parameter of 400, above those its accuracy statement gives for the 1990s and above what the 2011 to 2017 replicate margins imply. Six-figure households’ share of the rent is among stabilized households paying a cash rent.
Files. Every number above is in results.json, written by analysis.py, which imports hvs.py, the 2023 survey loader, and hvs_income.py, the reader of every survey from 1993 to 2023 for the long view; both use replicates.py, the replicate-weight variance code, and all three are published beside it. data.csv holds the 2023 renter households with their weights and the variables used, among them the computed saving and the modelled chance of renewing in the freeze’s year; long_view.csv holds the thirty-year series. The code bundle, who-gets-the-rent-freeze-code.zip, packs all of that code with the rest of the shared library it needs, so the build reruns on your own machine. The surveys’ replicate weights are in the public files the script reads.
Continue exploring New York

The six-figure renter
A six-figure income doesn't settle whether a New York household can afford its rent.

Who is leaving New York, and who is arriving
New York is not emptying out; it runs a steady exchange with the rest of the country that ends in a loss every year, a net 114,000 people in the year to July 2025.
- Explore this dataset: the data and the code behind every number above.
- All articles · Search · RSS
SparkyData Weekly
Once a week, one New York theme: what the public data says about it, and the week's new articles.
Free, weekly, and one click to leave. Your address is held by Buttondown, which sends it; see the privacy policy.
Sources
- NYC Department of Housing Preservation and Development and U.S. Census Bureau — 2023 New York City Housing and Vacancy Survey, public use files (Fieldwork January to June 2023; incomes are for 2022, rents for 2023; 80 replicate weights) — 960,700 rent-stabilized households (3,169 survey records); 30% with 2022 incomes of $100,000 or more and 66% of those with any income low income by HUD's FY2023 limits; median contract rent $1,500 and median income $60,000
- NYC Department of Housing Preservation and Development — 2023 NYCHVS Public Use File User Guide and Codebook (2024) — The regulation status, lease length (LEASE_LENGTH) and start, rental assistance (RENTASSIST), rent burden category (RENTBURDEN_CAT) and income-to-HUD-limit (HUDILFY23) variables, and the replicate weights FW1 to FW80
- NYC Department of Housing Preservation and Development — 2023 New York City Housing and Vacancy Survey: Selected Initial Findings (2024) — Published counts and medians the survey files reproduce: 960,700 stabilized households, 996,600 stabilized units, a 1.41% net rental vacancy rate
- U.S. Census Bureau and NYC Department of Housing Preservation and Development — New York City Housing and Vacancy Survey public use files, 1993 to 2021 (Surveys of 1993, 1996, 1999, 2002, 2005, 2008, 2011, 2014, 2017 and 2021 (2002 to 2008 from the Census Bureau's 2008 longitudinal release); incomes for the year before each survey) — The long view: household income, contract rent and control status of renter households, read at the positions of each year's record layout; replicate weights from 2011
- U.S. Census Bureau — NYCHVS Series IA, Table 9: Total household income, renter-occupied units by rent regulation status, 1999 to 2014 (Published tables of the 1999 to 2014 surveys) — The household counts and median incomes the older files reproduce, for all renters and for stabilized households
- NYC Department of Housing Preservation and Development — 1996 New York City Housing and Vacancy Survey: Selected Initial Findings (1997) — Renters' median incomes the files reproduce: $20,800 for 1992 and $23,892 for 1995
- NYC Department of Housing Preservation and Development — 1999 New York City Housing and Vacancy Survey: Selected Initial Findings (2000) — Median incomes for 1998 the files reproduce: stabilized households $27,000, private unregulated renters $35,350
- NYC Department of Housing Preservation and Development — 2017 New York City Housing and Vacancy Survey: Initial Findings (2018) — Median incomes for 2016 the files reproduce (stabilized $44,560, private non-regulated $67,000), and the 2017 recode: about 62,000 apartments registered with the state as permanently exempt, after which comparisons of the stabilized population with earlier surveys call for caution
- NYC Department of Housing Preservation and Development — 2021 New York City Housing and Vacancy Survey: Selected Initial Findings (2022) — Stabilized households' median income for 2020, $47,000, which the files reproduce, and the redesign: income questions restructured, more kinds of income counted and more records behind stabilization status (Appendix B)
- U.S. Bureau of Labor Statistics — Consumer Price Index for All Urban Consumers, New York-Newark-Jersey City, all items (CUURS12ASA0) (Annual averages, 1992 to 2022) — Converts each survey's incomes to 2022 dollars: $100,000 in 2022 is about $48,400 of 1992 income
- NYC Rent Guidelines Board — 2024 Income and Affordability Study (April 2024, from the 2023 NYCHVS) — 30% of stabilized households with incomes of $100,000 or more against 47% of market renters; a median gross rent-to-income ratio of 28.8% for stabilized tenants without a voucher
- NYC Rent Guidelines Board — 2026 Summary of Proposed Apartment/Loft and Hotel Guidelines (2026-27) (Preliminary vote of 7 May 2026) — Proposed ranges of 0% to 2% for a one-year lease and 0% to 4% for a two-year lease, set beside the benchmark used here
- NYC Rent Guidelines Board — Adopted Summary of Guidelines, 2026-27 (Apartment and Loft Order #58, Hotel Order #56) (Adopted 25 June 2026; leases starting 1 October 2026 to 30 September 2027) — 0% for one-year and 0% for two-year leases, together with such further adjustments as may be authorized by law; 0% for lofts and, under the hotel order, for hotels, lodging and rooming houses and SROs
- NYC Rent Guidelines Board — 2025-26 Apartment and Loft Order #57 (Adopted 30 June 2025; leases starting 1 October 2025 to 30 September 2026) — 3% for a one-year lease and 4.5% for a two-year lease, the benchmark the freeze is set against
- NYC Rent Guidelines Board — Apartment Orders #1 through #58 (The board's summary chart of every order, for leases from July 1968, retrieved 1 October 2026) — One-year renewals frozen in 2015, 2016, 2020 and 2026; a two-year renewal frozen for its whole term only in 2026; 15 of the 21 orders for leases before 1990 allowed 6% or more on a one-year renewal
- NYC Department of Housing Preservation and Development — HPD Builds Momentum Ahead of 2026 NYC Housing and Vacancy Survey (press release 068-25) (6 October 2025) — The 2026 survey, run with the University of Michigan's Institute for Social Research; no results published as of October 2026
- Spectrum News NY1 — Landlords sue Rent Guidelines Board over rent freeze (23 July 2026) — A group of building owners sued to void the freeze and have the board meet again
- Spectrum News NY1 — NYC rent freeze takes effect amid ongoing legal challenge (1 October 2026) — The freeze took effect on 1 October with the owners' suit still before the court
How to cite
Reference
BibTeX
Quote the version: a correction bumps it, and the corrections log says what changed. Charts can be embedded from the “Embed this chart” link under each one.