
Ask ten New Yorkers whether people are leaving the city and you will get ten confident answers and ten different reasons: taxes, rent, remote work, Florida, the schools, the subway. The numbers most of those answers rest on are nets. The Census Bureau’s population estimates for the year to July 2025 say the city gained about 36,000 people from births over deaths and 66,000 from net international migration, lost about 114,000 to net domestic migration, and ended the year 12,000 smaller. A net figure of that kind is the difference between two much larger numbers, and it says nothing about who is in either of them.
The census asks the question that opens the nets up. Every year it asks a sample of residents where they lived one year earlier, so for everyone now in the five boroughs it knows whether they were in the same house, another borough, the suburbs, another state or another country, and it records their age, education, citizenship and household alongside. In its 2024 survey, about 143,000 of the city’s residents had lived in a different state a year earlier and about 98,000 abroad.
That table has one hole in it: it counts people by where they live now, so nobody who left the city is in it. Someone who moved from Queens to Nassau County in 2024 answered the same census question from Nassau County, and their record sits in the national file, not the city’s. So let’s read both files, the New York file for the arrivals and the national file for the leavers, for every year from 2015 to 2024, and put the two flows side by side with the people in them. Every chart is interactive, and the records and code sit at the end.
Three hundred thousand out, a hundred and eighty in
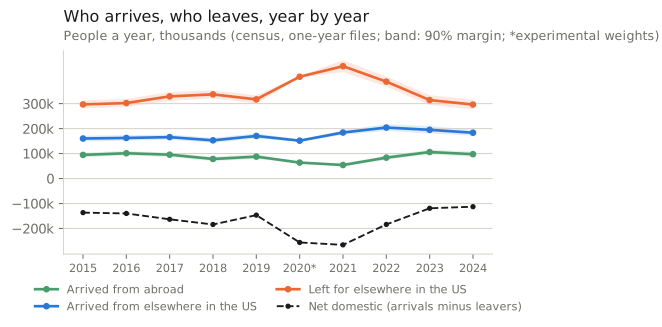
Start with the size of the flows in the latest census year. In 2024 about 296,000 people who had lived in the five boroughs a year earlier were living somewhere else in the United States, and about 183,000 residents had moved in from somewhere else in the country.
The difference is a Net domestic migration, two ways In the census microdata: people who arrived from elsewhere in the United States in the past year minus people who left for elsewhere in the United States, both counted in the same survey year with the same replicate weights, so the margin covers both sides.In the Census Bureau’s population estimates: a July-to-July figure built from address changes on tax returns and Medicare enrolment, with no sampling margin. The two measure the same idea by different means and are not expected to match exactly. of about 113,000 people, with a margin of about 25,000 either way. Another 98,000 residents had lived outside the country a year earlier. Add the people who changed addresses inside the five boroughs and more than a million people moved into, out of or within the city in a year.
Ten years earlier the picture was almost identical. In 2015 about 297,000 people left for the rest of the country, and the net domestic loss was about 137,000.
What happened in between is the pandemic, and it is worth stating exactly. Departures rose by about half, to a peak of 450,000 in 2021. Arrivals did not rise with them, so the net domestic loss nearly doubled, to 266,000. Then it all came down as fast as it went up, and by 2024 departures were back at their 2015 level.
The share of last year’s residents who left for elsewhere in the country, the The out-migration rate Leavers divided by everyone who lived in the city a year ago and is still in a US census file: the people who stayed, the people who moved within the city and the leavers. It leaves out people who died or moved abroad during the year, so it is the share of last year’s residents who are now somewhere else in the country. Group characteristics (age, income, tenure) are as measured now, after any move. , says the same thing: 3.5% in 2015 and again in 2024, with 5.2% at the 2021 peak.
Measured Tabulated from survey microdata. Every variable in the chart is observed in the same record, so the relationship shown is measured rather than modelled, and the ticks are 90% margins from the survey’s replicate weights.
How to read this, and what it cannot show
One bar per survey year, with the 90% margin of error as a black tick. Leavers are people with a five-borough Residence one year ago The census asks every person one year old and over whether they lived in the same house a year earlier and, if not, where: the state or country and, within a state, a “migration PUMA”, an area of at least 100,000 people that nests inside counties. The five boroughs are each their own migration PUMA, so a person’s answer says whether they came from another borough, the suburbs, elsewhere in the state, another state or abroad.A person who left the city answers the same question from wherever they live now, which is why leavers are found in the national file rather than New York’s. found anywhere else in the national census file. The 2020 file was released with the Bureau’s experimental weights after the pandemic wrecked response rates.
Before going further, a check. The published table’s five rows, same house, moved within the county, from another county in the state, from another state, and from abroad, all reproduce from the microdata within the published margin in each year from 2021 to 2024, and the 2019 rows land within the margin on the difference. The full comparison is in the Reproduce box below. From here on every number is one the table does not print.
Where they come from, and where they go
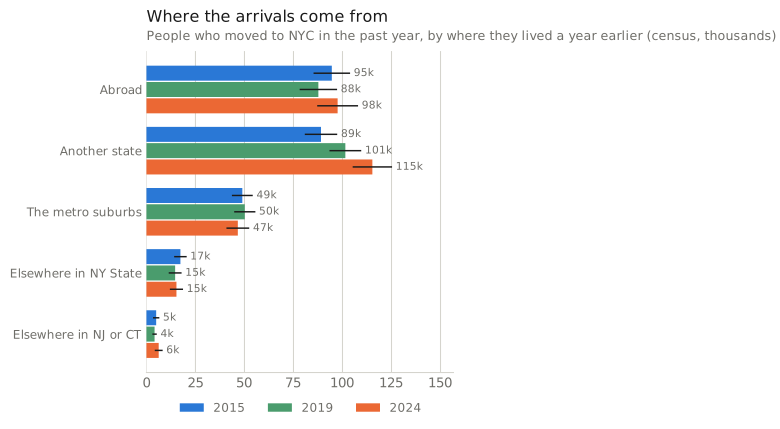
Sort the 2024 arrivals by where they were a year earlier and the largest group is not the immigrants. About 115,000 came from another state, four in ten of all arrivals. Arrivals from abroad were about a third, and about 47,000 came in from the metro suburbs.
The arrival from another state is the census’s most consistent character across the decade: a median age of 27, mostly graduates, about a quarter of them students. The arrival from the suburbs is nearly the same person. The arrival from abroad is different, and gets a section below.
Measured Tabulated from survey microdata. Every variable in the chart is observed in the same record, so the relationship shown is measured rather than modelled, and the ticks are 90% margins from the survey’s replicate weights.
How to read this, and what it cannot show
One group of bars per origin, 2015, 2019 and 2024, with 90% margins. The suburbs are Long Island, the Lower Hudson Valley, northern New Jersey and southwestern Connecticut, identified from the migration area a year earlier. Abroad includes Puerto Rico, as in the published table.
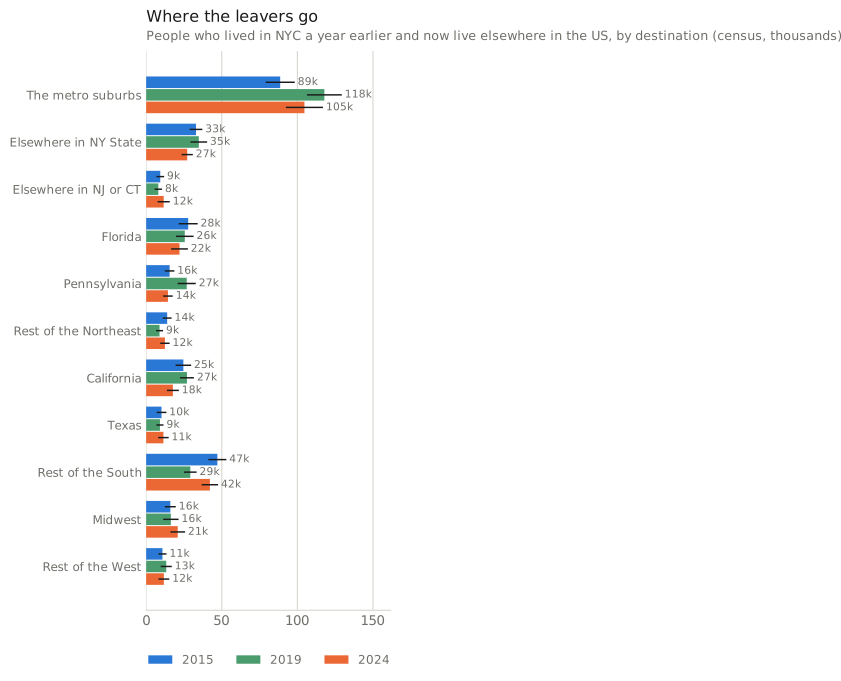
The leaver’s destinations are more spread out, and the biggest is the shortest move. Of the people who left in 2024, about 105,000, or 35%, went to the metro suburbs: northern New Jersey first, then Long Island, the Lower Hudson Valley and southwestern Connecticut.
Florida, the destination everyone names, took about 22,000, or 7% of leavers, fewer than it took in 2015. California, Pennsylvania and Texas follow, and the list of states ran in almost the same order ten years ago.
Measured Tabulated from survey microdata. Every variable in the chart is observed in the same record, so the relationship shown is measured rather than modelled, and the ticks are 90% margins from the survey’s replicate weights.
How to read this, and what it cannot show
One group of bars per destination, 2015, 2019 and 2024, with 90% margins. Destinations are where the person lives at the survey; the suburbs are the same four regions as the origins chart.
The suburban move is the one that shapes the city’s balance with its own region. The suburbs sent about 47,000 people into the city in 2024 and received 105,000 from it, so the city lost more people, on balance, to its own suburbs than to all the other states combined. In 2015 it was the other way round.
The suburban leaver is 32 at the median, and the household they now live in is, 58% of the time, an owner-occupied one; nearly half of those households have children. About half of the employed ones still report a workplace in the five boroughs, and the FAQ says more about them.
Who the city loses, and who it gains
The net figure by group is the part of the story that a citywide number hides completely, so let’s split it, starting with the attributes a person carries with them when they move: age, education, race, nativity.
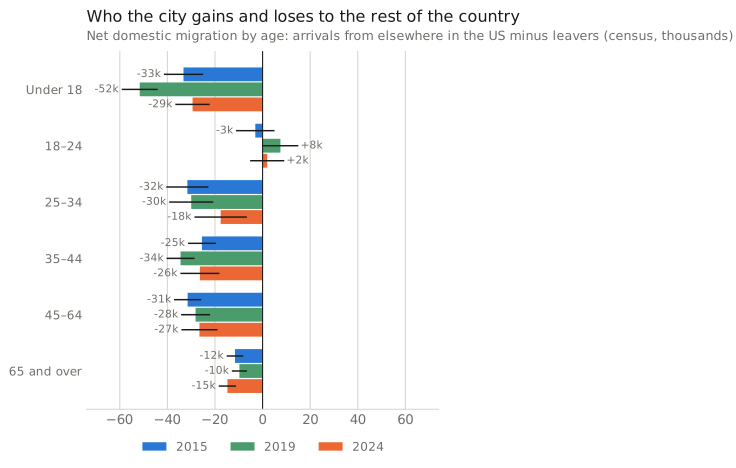
The city gains one age group from the rest of the country, and only one: people aged eighteen to twenty-four. It loses every other age, and it loses children most. The net domestic loss of children was about 29,000 in 2024 and 52,000 in 2019.
Measured Tabulated from survey microdata. Every variable in the chart is observed in the same record, so the relationship shown is measured rather than modelled, and the ticks are 90% margins from the survey’s replicate weights.
How to read this, and what it cannot show
Arrivals from elsewhere in the United States minus leavers, by group, for 2015, 2019 and 2024; a bar to the left of zero is a net loss. Age, race, nativity and degree belong to the person. Income, tenure and children describe the household the person lives in now, after any move, so those three views show the destination households of leavers against the city households of arrivals, not what anyone had before moving. The margins on the net are wide because both sides are sampled.
Education cuts the other way from what the departure rates suggest. People with a degree leave at a higher rate than people without one, but the net loss is larger among the non-graduates, about 53,000 against 32,000, because the arrivals are so heavily graduates.
The US-born make up about two-thirds of the net loss and the foreign-born the rest. Hispanic residents had the largest net loss of any group, about 41,000. The FAQ gives the rate at which each group leaves, by age, education, race and borough.
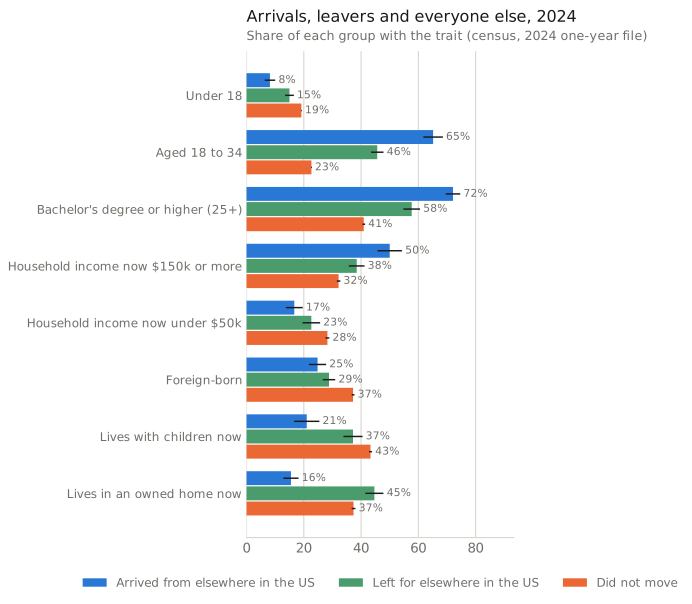
Now put arrivals, leavers and the people who did not move side by side for 2024. Among people who arrived from elsewhere in the country, 65% are aged eighteen to thirty-four. Among leavers it is a little under half, and among people who stayed put, under a quarter.
Degrees run in the same order: 72% of the adult arrivals hold one, 58% of the leavers and 41% of the stayers.
Age runs the other way. The median domestic arrival is 27; the median leaver is four years older, and the median stayer is 40.
The household variables need a different reading, because the census records the household a person lives in now. After the move, 45% of leavers live in owner-occupied homes against 16% of arrivals, and leavers live with children nearly twice as often.
Those are facts about the households the two groups join or form, in the suburbs and in the city: arrivals overwhelmingly join renter households and are less likely to live with children, and leavers are much more likely to end up in owner-occupied households and in households with children. What they cannot say is what any leaver’s household earned or owned in New York the year before, and the FAQ spells out why.
Measured Tabulated from survey microdata. Every variable in the chart is observed in the same record, so the relationship shown is measured rather than modelled, and the ticks are 90% margins from the survey’s replicate weights.
How to read this, and what it cannot show
Three bars per trait: people who arrived from elsewhere in the United States, people who left for it, and people who did not move, in the year chosen. Degree among people 25 and over; employment among 16 and over; enrolment among 18 and over. Income, children and tenure describe the household the person lives in now, after any move, and are measured among people in households.
The shape of that table barely changed between the benchmark years; the 2015 and 2019 versions of the chart look like the 2024 one. That is the constant in the story: the city’s exchange with the rest of the country runs younger in and older out, graduate in and children out. The pandemic years fit it too, with one wrinkle. In 2021 the arrivals looked as they always do, while the leavers were a little more graduate than usual, 62% of adults against 58% at most in the benchmark years. The pandemic changed the volume much more than the basic profile of who moves.
The flow that changed: arrivals from abroad
The arrival from abroad is a different person from the arrival from Ohio, and the difference has grown. In 2024 about 98,000 residents had lived outside the United States a year earlier. 71% of them were not US citizens, and about a fifth were Americans coming home.
Half the adults hold a degree, against 78% of arrivals from other states, and fewer than half of those old enough to work were employed. In 2019 both shares were higher; 61% of the adults held a degree.
Where they come from moved too, and here the census asks two different questions. Its place-of-birth item says where a person was born; its migration item says which country they lived in a year ago, which is the question that matters for a flow.
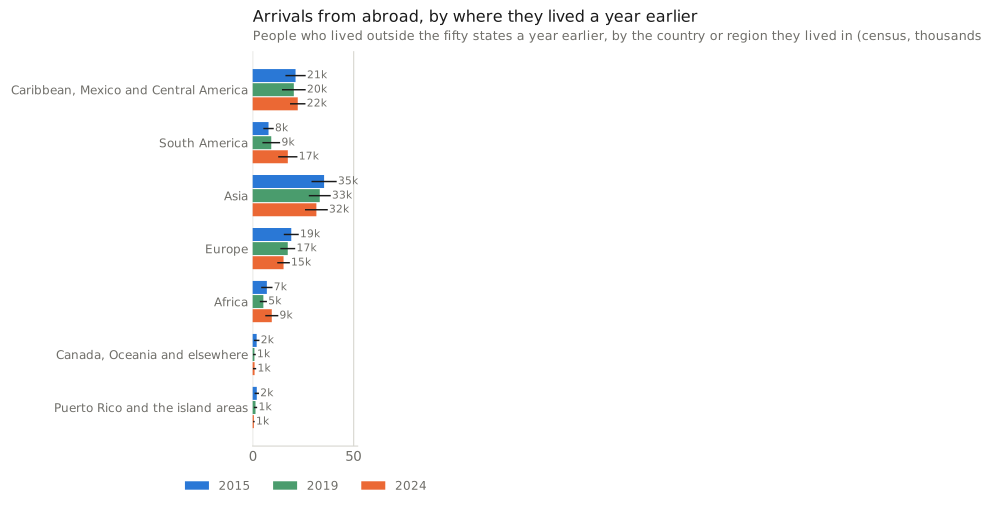
By country of residence, Asia supplied 37% of the 2015 arrivals from abroad and 32% of the 2024 ones, still the largest share. The growth was elsewhere: South America and Africa together went from about a seventh of arrivals to more than a quarter.
The census releases many countries of residence only as regions, so the largest named countries are the ones it names: China (with Hong Kong and Macau) and the Dominican Republic in every year, Ecuador and Mexico in the later ones. Nothing in the census says which of these arrivals came through the city’s shelter system and which came on a work visa or a student visa; it records where they lived last year, and the totals here are of everyone.
Measured Tabulated from survey microdata. Every variable in the chart is observed in the same record, so the relationship shown is measured rather than modelled, and the ticks are 90% margins from the survey’s replicate weights.
How to read this, and what it cannot show
Arrivals from abroad by the country or region they lived in a year ago, 2015, 2019 and 2024. Switch to region of birth to see the other census question: a US-born person who lived abroad a year ago is a returning American there, and a Venezuelan-born person who lived in Colombia is South American under both. Abroad includes Puerto Rico.
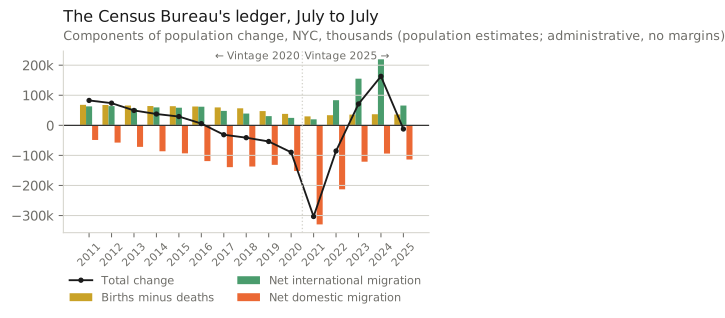
The census microdata stops at the 2024 survey. For 2025 we switch to the Census Bureau’s own accounting of births, deaths and migration, which has no sampling margin and runs to July 2025.
The Census Bureau does not wait for the survey to estimate the city’s population. Each year it takes the last census count and adds births, subtracts deaths, and adds its estimates of net international and net domestic migration, the latter built from address changes on tax returns and Medicare files. That The population estimates Every year the Census Bureau estimates each county’s population on 1 July by taking the last census count and adding births, subtracting deaths, and adding net international and net domestic migration. Domestic migration comes from year-to-year address changes on federal tax returns and Medicare files; international migration from the American Community Survey’s foreign-born counts and administrative data on humanitarian arrivals.Each “vintage” revises the whole series back to the census, so the 2011–2020 figures (built on the 2010 count) and the 2021–2025 figures (built on the 2020 count) come from different vintages and do not join cleanly. , summed over the five counties, is where the net figures in the first paragraph come from.
Its international line is the one that broke from the decade’s pattern. Net international migration ran at 30,000 to 64,000 a year through the 2010s, then reached 155,000 in the year to July 2023 and 220,000 in the year to July 2024, the highest in the series.
In the year to July 2025 it fell back to about 66,000, a level last seen in 2016. The net domestic loss that year was about 114,000, and the population slipped by about 12,000.
Administrative Counts from an agency’s own records, such as turnstiles and toll plazas. They carry no sampling margin, but they count trips or transactions rather than people, and they cannot be cut by who the traveller is.
How to read this, and what it cannot show
One bar per July-to-July year; switch the measure. The years to 2020 come from the Bureau’s Vintage 2020 series, built on the 2010 census, and 2021 onward from Vintage 2025, built on the 2020 census. The two do not splice: the 2020 count found about 550,000 more residents than the earlier series carried, so the levels on either side of the line are not comparable. No margins; the reading guide says how each component is estimated.
One caution matters more than the rest. The ledger’s 220,000 and the census’s 98,000 are not two points on one series. The ledger’s figure is an estimate of immigration minus emigration, built from survey and administrative sources and revised upward when the Bureau changed how it counts humanitarian migrants; the census figure is a count of arrivals from one survey. They are different measurements, and the comparison that holds is within the ledger.
The ledger is also revised every year, by amounts that are not small, and its domestic figure runs a little below the census’s. The FAQ covers both, along with three sources that reach later than the ledger: the tax returns, which carry the incomes of the households that moved, and the shelter census and the monthly survey, which run to September 2026 and show no detectable rise in the city’s foreign-born population since the 2024 file.
So who is leaving, and who is arriving?
Not the same people, and not, in 2024, in unusual numbers. The city sends about 300,000 people a year to the rest of the country and takes in about 180,000 from it, and it has done so at close to that rate for a decade, with a two-year pandemic exception that raised departures by half and was over by 2023. The people who leave are in their late twenties and thirties, more often than not with a degree, a third of them bound for the metro suburbs, where most now live in owner-occupied homes and about half of the employed ones still report a workplace in the five boroughs. The people who arrive from the rest of the country are younger and better educated, and they join the city’s better-paid households. Counted by who they are, the exchange makes the city younger and more graduate and costs it children, the US-born and the non-graduate, and it did so in each of the benchmark years at roughly the same rate.
The decade’s biggest break from the old pattern came from international migration. In the census, arrivals from abroad looked much the same in 2015 and 2019, about 90,000 a year, more than a third from Asia, a fifth Americans returning; the 2024 file shows more of them coming from South America and Africa and fewer employed or degree-holding.
The Bureau’s separate ledger, which estimates emigration as well as immigration and is not comparable with that count, tells the more dramatic version. Net international migration more than tripled from its highest level of the 2010s, to 220,000 in the year to July 2024, and fell back to about 66,000 the year after. Nothing in the two series that reach into 2026 shows the foreign-born population rising since. The domestic exchange is the constant; the international one is what moved.
Cut the data your own way
The dashboard runs on the 217,000 census records behind the 2015, 2019 and 2024 comparisons: every resident of the five boroughs in those years, and everyone who had lived there a year earlier and answered the census from somewhere else in the country. Pick a year and a flow, then narrow by borough, age, degree, household income and race, and see how many people that is and what they look like. Income, tenure and children are the household the person lives in now.
People in each flow, under the filters above
Loading the census records…
Every number here is a weighted tabulation of census microdata records, so the cross-tabulations it shows are measured relationships within one survey. Nothing is modelled. The headline tile carries an approximate 90% margin: a binomial margin on the record count, scaled by a design effect calibrated on the article's replicate-weight margins (click the ? on the tile). The article's charts carry the exact margins; treat any selection with a wide margin as indicative.
Year
The one-year census file: 2015 for the start of the decade, 2019 for the last year before the pandemic, 2024 the latest published. Residents come from the New York file and leavers from the national file of the same year; each year is its own sample of about 75,000 people connected to the city.
Who
From the census question on residence one year ago. Residents either did not move, moved within the five boroughs, or arrived from abroad, another state, the metro suburbs (Long Island, the Lower Hudson Valley, northern New Jersey, southwestern Connecticut) or elsewhere in New York, New Jersey or Connecticut. Leavers lived in the city a year ago and answered the census from elsewhere in the United States. People who left the country are in no survey.
Borough
For residents, where they live now. For leavers, the borough they left. Nothing here goes below the borough.
Age
Age at the survey. The census asks about residence a year ago only of people one and over, so infants are not in any flow.
Degree
Whether a person 25 or over holds a bachelor's degree or higher. Choosing a degree option drops everyone under 25 from the selection.
Household income
The total income of the household the person lives in now, after any move, in 2024 dollars. People in group quarters (dormitories, nursing homes, shelters) have no household income and drop out when an income band is chosen.
Race or ethnicity
Hispanic of any race; the other groups are non-Hispanic.
Born abroad
The share of the selection born outside the United States and its territories. A weighted tabulation of the census records in the selection, with an approximate 90% margin beside it (see the ± button).
People, weighted estimate
The sum of the survey weights of the records in the selection: the Bureau's estimate of how many people these records stand for. Rounded to the nearest hundred. Each record in a one-year file stands for roughly a hundred people, so treat a small selection as an order of magnitude.
Average age
The weighted mean age of the selection.
Hold a degree
Among people 25 and over in the selection, the share with a bachelor's degree or higher.
Median household income
The median of the household incomes of the people in the selection (people in households only), in 2024 dollars, interpolated within the income band the median falls in, so it is approximate. For a mover it is the income of the household they live in now.
Employed
Among people 16 and over in the selection, the share who were employed in the survey week.
Live in an owned home
Among people in households, the share whose household owns its home, with or without a mortgage. For a leaver, the home they live in now.
Live with children
Among people in households, the share whose household includes someone under 18.
By flow
Each bar is the number of people in one flow under the filters above (the flow filter itself is ignored here, so the bars always show the whole picture). Flows with fewer than 30 records in the selection are marked too few.
The ± figure
An approximate 90% margin of error on the headline share. The dashboard cannot carry the 80 replicate weights the article's charts use, so it estimates the margin as 1.645 × √(deff × p(1 − p) ÷ n): n is the number of census records in the selection and deff is the design effect, the ratio of the survey's true sampling variance to that of a simple random sample of the same size.
The design effect is calibrated from the article's own charts: for every chart cell, (replicate-weight margin ÷ binomial margin)², and the median is used. The note under the chart gives the effective sample size, n ÷ deff. For any cut the charts precompute, the chart's margin is the exact one.
Too few people
Fewer than 30 census records match, so the numbers would be noise. Widen a filter.
Questions this raises
How well do these numbers match the Bureau’s own?
Closely, and that is the check everything else rests on. The Bureau’s 2024 table reports 8,387,686 residents one year and over, 7,586,955 in the same house a year earlier, 401,043 who moved within their borough, 157,700 from another New York county, 143,496 from another state and 98,492 from abroad. Rebuilding the same rows from the 2024 microdata gives 8,388,298, 7,589,556, 405,800, 153,304, 142,120 and 97,518, each inside the published Margins of error from replicate weights Each PUMS record carries 80 replicate weights alongside its main weight. A statistic is recomputed 80 times, once with each replicate, and the spread of those 80 answers around the main answer gives its standard error: variance = 4/80 × Σ(θr − θ)². The Census Bureau reports 90% margins, 1.645 standard errors, and every census margin in this article follows that convention.This is the Bureau’s own method (successive difference replication), so a margin here matches what the Bureau would publish for the same cut. . The 2021, 2022 and 2023 tables reproduce the same way. In 2019 the same-house and same-borough rows differ from the published figures by 38,000 and 27,000, more than either margin alone and inside the margin on the difference, which is the Bureau’s own test; the other three 2019 rows are inside their margins. The full comparison is in the Reproduce box and the reproduction table. The leavers have no published table to check against, which is the reason to build them.
What do the flows look like year by year?
In 2015 about 297,000 people left for the rest of the country, 160,000 arrived from it and 95,000 arrived from abroad. Departures were 317,000 in 2019, 407,000 in the 2020 survey and 450,000 in 2021, while arrivals from abroad fell to 54,000; then 388,000 leavers in 2022, 314,000 in 2023 and 296,000 in 2024. Domestic arrivals moved far less, between 152,000 and 204,000 across the decade, which is why the net domestic loss, 137,000 in 2015, reached 266,000 in 2021 and was back to 113,000 in 2024. About 518,000 people moved from one address to another within the five boroughs in 2024. The full series with margins is in the methods note at the end.
Where exactly do arrivals come from, and where do leavers go?
Of the 2024 arrivals, about 115,000 came from another state, 41% of the total; 98,000 from abroad, 35%; 47,000 from the metro suburbs, 17%; and about 21,000 from elsewhere in New York, New Jersey or Connecticut. Seven in ten of the arrivals from other states are aged 18 to 34 and 78% of those 25 and over hold a degree.
Of the 296,000 leavers, about 105,000 went to the suburbs: 41,000 to northern New Jersey, 30,000 to Long Island, 28,000 to the Lower Hudson Valley and 6,000 to southwestern Connecticut. Another 27,000 went elsewhere in New York State and 12,000 elsewhere in New Jersey or Connecticut. Florida took about 22,000, against 28,000 in 2015; California 18,000, Pennsylvania 14,000, Texas 11,000; the rest of the South together 42,000 and the Midwest 21,000. By state the list runs New York, New Jersey, Florida, California, Pennsylvania, Connecticut, Texas, Massachusetts.
The exchange with the suburbs was a net loss of about 58,000 in 2024, against about 38,000 to all the other states combined. In 2015 those figures were 40,000 and 77,000, and in 2019 the suburban figure had already grown to 68,000.
Which groups leave at the highest rates, and which boroughs?
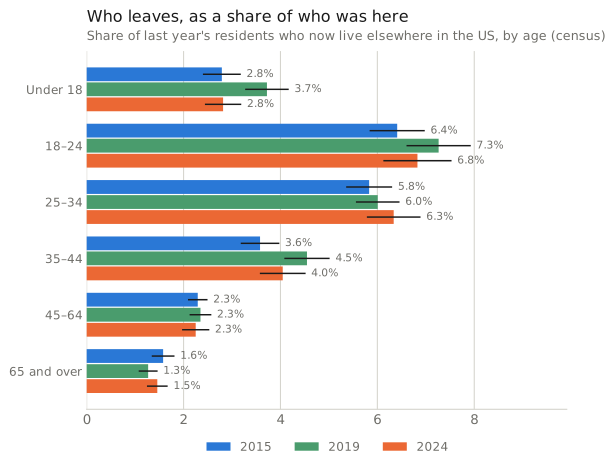
The young. In 2024, 6.8% of the 18-to-24-year-olds who lived in the city a year earlier had left for elsewhere in the country, 6.3% of 25-to-34-year-olds, then 4.0%, 2.3% and 1.5% up the age bands. The young leave at the highest rates and arrive in the largest numbers, which is how the city gains a few thousand 18-to-24-year-olds on balance, 8,000 in 2019, while the middle-aged leave less often and are barely replaced. People with a degree leave at 4.6% a year and those without at 2.5%. White residents leave at the highest rate of any group, 4.3%; the net losses were 41,000 Hispanic residents, 27,000 white residents and 24,000 Black residents, and 73,000 US-born against 40,000 foreign-born.
Measured Tabulated from survey microdata. Every variable in the chart is observed in the same record, so the relationship shown is measured rather than modelled, and the ticks are 90% margins from the survey’s replicate weights.
How to read this, and what it cannot show
Leavers as a share of everyone who lived in the city a year earlier and is still in a US census file. It leaves out people who died or moved abroad. The income, tenure and children rates classify a leaver by the household they live in now, not the one they left, so they are not propensities to leave by prior circumstance. Groups resting on fewer than ten leaver records are not drawn.
By borough the exchange with the rest of the country is a Manhattan story on one side and an outer-borough story on the other. Manhattan received 87,000 domestic arrivals in 2024 and sent out 80,000, roughly a wash; Brooklyn lost a net 43,000, Queens 38,000, the Bronx 28,000 and Staten Island 10,000. Manhattan also has the highest out-migration rate, 5.0%, and the highest arrival rate; it is the borough people pass through.
Why is income measured after the move, and what does that rule out?
In 2024 half the domestic arrivals lived in city households at 150,000 against 150,000, or the 4.5% out-migration rate among people now in households above 300,000 household or a homeowner when the person who now lives in one left. The person-level attributes, age, race, nativity and, for adults, degree, do travel with the person, and the claims about what the city gains and loses are made on those.
Who are the arrivals from abroad, in full?
Of the roughly 98,000 residents in 2024 who had lived outside the United States a year earlier, 71% were not US citizens, 6% were naturalised citizens and 22% were US citizens by birth, mostly Americans coming home. Half the adults hold a degree, against 78% of arrivals from other states; 46% of those 16 and over were employed, against 68%; 36% now live in households under $50,000, against 17%; and more than half live with children. In 2019, 61% of the adults held a degree and 51% were employed.
By country of residence a year earlier, Asia supplied 37% of the 2015 arrivals, the Caribbean, Mexico and Central America 22%, Europe 20%, South America 8% and Africa 7%. In 2024 Asia’s share was 32%, the Caribbean and Central America 23%, South America 18%, Europe 16% and Africa 10%.
Why is the Bureau’s international figure more than twice the census’s count of arrivals?
Because they are different measurements, and an ordinary net flow could not be twice its own gross inflow. The census figure, about 98,000 in 2024, counts residents who say they lived abroad a year ago, from one survey, over a calendar year. The ledger’s 219,578 for the year to July 2024 is an estimate of immigration minus emigration for a July-to-July year, built from the survey and from administrative records, and it includes an adjustment for humanitarian migrants that the Bureau introduced and then revised; that revision is most of the reason the July 2024 population estimate for the city rose from 8,478,000 to 8,597,000 in one vintage. So the surge is read within the ledger: net international migration of 30,000 to 64,000 a year from 2011 to 2019, about 20,000 in the year to July 2021, 84,000 in the year to July 2022, 155,000, 219,578, and then 65,824 in the year to July 2025.
How has the Bureau’s ledger moved over the decade, and how far is it revised?
It tells the decade in three acts. Through the 2010s the city gained 60,000 to 68,000 a year from births over deaths, falling to 47,000 by 2019, and lost between 49,000 and 152,000 a year to the rest of the country, a domestic loss that grew to more than 130,000 a year from 2017. Then the pandemic: a net domestic loss of 330,000 in the year to July 2021 and 213,000 the year after. Then the international surge, during which the domestic loss fell back to about 94,000 and the population rose by 163,000 in the year to July 2024. In the year to July 2025 the domestic loss was 113,718 and the population slipped by 12,196.
The revisions are not small. Beyond the 2024 revision described above, the Bureau cut its 2017 estimate for the city by 184,000 in another vintage. Each new vintage replaces the whole series back to the last census, so the 2025 figures here will change in March 2027.
Why does the census’s net domestic figure differ from the Census Bureau’s?
Because they are two measurements. The microdata counts people by asking them where they lived a year ago, in a calendar-year survey, and subtracts leavers from arrivals with a sampling margin of about 25,000. The population estimates infer domestic migration from address changes on federal tax returns and Medicare enrolment over a July-to-July year, with no sampling margin but with revisions every vintage. For the year to July 2024 the ledger says a net loss of about 94,000; the 2024 survey says about 113,000, and the year to July 2025 ledger says 114,000. For 2015 the two were 93,000 and 137,000. The survey counts students, people who do not file and the young who file from a parent’s address; the ledger counts the flows the tax records see. Across the decade the two move together, and neither should be quoted to the nearest thousand.
Who left in 2020 and 2021?
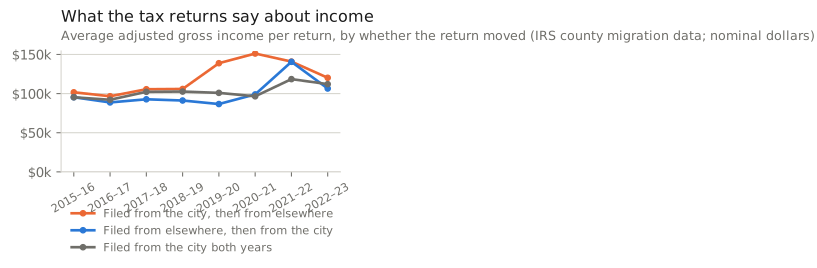
More of everyone, and, on the tax returns, disproportionately the well paid. The out-migration rate rose from 3.8% in 2019 to 5.2% in 2021, and the increase reached every age band, every borough and every income band of the households people ended up in. The IRS county migration data The Internal Revenue Service matches individual returns across two filing years and counts, for every pair of counties, the returns whose address moved from one to the other, the exemptions on them (roughly the people) and their adjusted gross income. It sees filers only: students, most new arrivals from abroad, and people who do not file are absent, and a household that moves in April may show its old address on one return and its new one on the next. , which match returns across two filing years and see the income a household reported both before and after it moved, say the same thing in dollars: the average income on a return that left the city was 151,000 in 2020–21 and 100,000 for a return that stayed, where before 2019 the two had been within a few thousand dollars of each other. By 2022–23 the leaving return was back to 112,000 for stayers. The profile of movers shifted less than the volume. In 2021, 68% of domestic arrivals were aged 18 to 34 and 74% of the adults held a degree, as in other years; among leavers 42% were 18 to 34, 19% were under 18 and 62% of the adults held a degree, against 53% to 58% in 2015, 2019 and 2024. The 2020 survey year carries the Bureau’s experimental weights and is drawn but not leaned on; the 2021 file is a standard release.
Are the rich leaving?
The question needs the tax returns, because they record a household’s income before it moved, which the census does not. In 2022–23 about 321,000 people were on returns that left the five counties and 194,000 on returns that arrived; the average return that left reported about 106,000, and the average return that stayed about 102,000, 95,000, close together; the gap opened in the pandemic and has mostly closed. The state Comptroller’s dashboard, which covers the whole state rather than the city, reports for tax year 2024 a net loss concentrated among married filers earning 500,000 and a net out-migration rate of about 1% among filers above $500,000, the highest of any bracket, against a statewide net rate of −0.14%. So: the highest earners leave at a higher net rate than the middle, and in far smaller numbers, and the average leaving household earns somewhat more than the average staying one. The census’s income bands, being measured after the move, cannot add to that; the destinations on the returns are the census’s destinations, the rest of New York State first, then New Jersey, Florida, Pennsylvania, California and Connecticut.
Administrative Counts from an agency’s own records, such as turnstiles and toll plazas. They carry no sampling margin, but they count trips or transactions rather than people, and they cannot be cut by who the traveller is.
How to read this, and what it cannot show
One bar per pair of filing years; switch between the average income of leaving, arriving and staying returns and the headcounts. Nominal dollars. Filers only, so students, most new arrivals from abroad and people who do not file are not in it, and a household that moves in April can show its old address on one return and its new one on the next. Flows between the five boroughs are removed.
Administrative Counts from an agency’s own records, such as turnstiles and toll plazas. They carry no sampling margin, but they count trips or transactions rather than people, and they cannot be cut by who the traveller is.
How to read this, and what it cannot show
People on returns that left the city for each state, or arrived from it, 2015–16 against 2022–23. New York means the rest of the state, mostly the suburbs. Switch between destinations and origins.
Do the people who move to the suburbs leave the city’s economy?
About half do not. Of the employed people who moved from the five boroughs to Long Island, the Lower Hudson Valley, northern New Jersey or southwestern Connecticut in 2024, 47% still had a workplace in the city, down from 55% in 2019, and a further share of all leavers, 23%, usually worked from home, three times the 2019 figure. The suburban move looks like a housing move more than a job move: 58% of the people who made it now live in an owner-occupied home, half in households above $150,000, and 46% with children. The reverse flow, 47,000 people a year from the suburbs into the city, is younger, 61% aged 18 to 34, with almost no children.
Where do the numbers say Florida?
Seventh in the census’s destinations and third on the tax returns. About 22,000 people who lived in the city in 2023 lived in Florida in 2024, 7% of leavers, against 28,000 in 2015; 105,000 went to the suburbs in the same year. On the IRS side, returns leaving the five counties for Florida carried about 30,000 people in 2022–23, behind the rest of New York State at 86,000 and New Jersey at 58,000. The Florida leaver in the census is older than the average leaver, 36 at the median against 31, and in 2024 six in ten of the adults held a degree and half now live in an owner-occupied home.
What can be said about 2026?
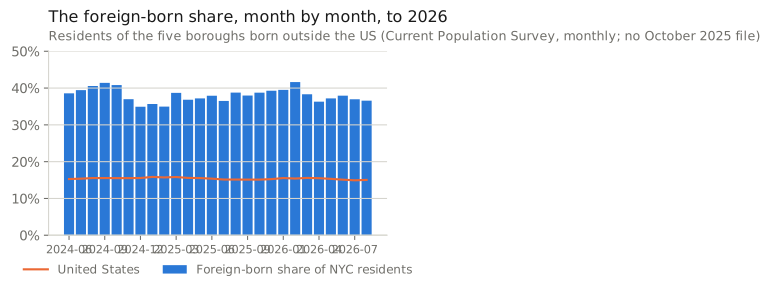
Less than the question deserves, and two indirect series say it. The first is the monthly survey behind the unemployment rate, which asks every household member where they were born and identifies the five boroughs. It has no question about last year, so it cannot count arrivals; what it measures is the size of the foreign-born population, a stock that immigration, emigration, domestic moves, deaths and the size of the US-born population all move. From June to December 2024 about 39% of the city’s residents were born abroad; from January to August 2025, about 37%; from January to August 2026, about 38%, with a margin of a point either way in each period that understates the true uncertainty, since consecutive months share most of their sample. The census’s 2024 file put the share at 37%. The honest reading is that the survey shows no detectable rise in the foreign-born share through August 2026, which is consistent with the surge having subsided, and that a stock measure cannot rule out new arrivals offset by departures or by growth elsewhere in the population.
Measured Tabulated from survey microdata. Every variable in the chart is observed in the same record, so the relationship shown is measured rather than modelled, and the ticks are 90% margins from the survey’s replicate weights.
How to read this, and what it cannot show
One bar per month; switch between the foreign-born share, the non-citizen share, the foreign-born count and the national share. About 1,300 to 1,500 residents a month, and adjacent months share most of their sample, so read the level and not the wiggles. No file exists for October 2025, when the survey was not conducted during the federal shutdown.
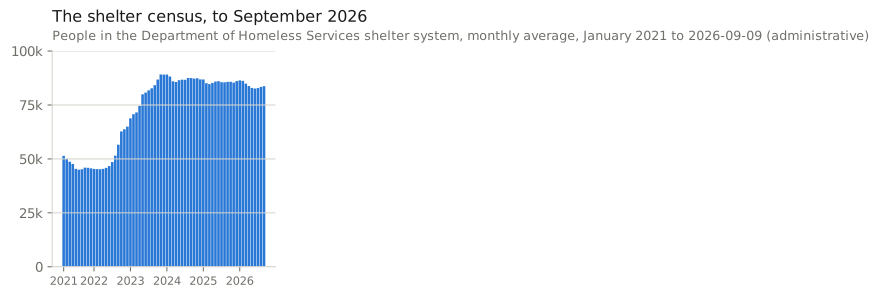
The second is context rather than measurement: the city’s daily count of people in the Department of Homeless Services shelter system, which includes asylum seekers in DHS shelters but does not separate them and excludes the humanitarian centres other agencies ran. It stood at about 45,000 people in March 2022, reached a monthly average of 89,000 in November 2023, and has been level since: 87,000 across 2024, 86,000 across 2025 and about 84,000 in September 2026. The Mayor’s office put the number of asylum seekers in the city’s care at about 69,000 at the January 2024 peak and under 37,000 in July 2025, with weekly arrivals down from 4,000 in May 2023 to under a hundred, and more than 237,000 people through the system since spring 2022. What the shelter series supports is that the arrivals of 2022 to 2024 have not been followed by a second wave large enough to move it; it cannot say more than that about migration.
Administrative Counts from an agency’s own records, such as turnstiles and toll plazas. They carry no sampling margin, but they count trips or transactions rather than people, and they cannot be cut by who the traveller is.
How to read this, and what it cannot show
One bar per month; switch between everyone in shelter, people in families with children, single adults and children. A daily administrative count averaged by month.
The releases that will eventually settle the picture are already in the pipeline. The census’s 2025 one-year file, which would show who arrived and left in 2025, has been delayed past its usual September release with no date announced. The IRS has not announced a date for its 2023–24 flows. The Bureau’s next ledger, to July 2026, is due in March 2027 and will revise 2025 again.
What about the people who left the country?
They are the hole in every number here. Nobody who moved from New York to Toronto, London or Santo Domingo answers a US survey, so the census sees arrivals from abroad but no departures to it, and the “net international migration” in the Bureau’s ledger is an estimate of emigration subtracted from an estimate of immigration. Movers to Puerto Rico are in the Puerto Rico Community Survey, which is not read here; they number a few hundred a year in the study area. The domestic flows have no such hole, because every state’s records are in the national file.
Why do the two population-estimate vintages not join up?
Because each vintage starts from the latest census count and the 2020 count was far above the estimates. The Vintage 2020 series carried the city at 8,253,000 in July 2020; the 2020 census counted about 8,804,000. The Bureau’s post-census series starts from the count, so the level jumps by more than half a million at the line in the chart, and the components on either side were estimated with different methods and different data. The chart shows both because the decade needs both, and labels the line. The Department of City Planning’s own long series splices them; the reading here does not.
Why not the March survey, which also asks about last year?
It was tried and set aside. The Current Population Survey’s March supplement asks where each person lived a year earlier and identifies the five boroughs, but its 2025 city sample is about 2,300 people, of whom about twenty had arrived from another state or abroad, too few for a rate with a useful margin. The basic monthly files are used instead for the one thing they measure well at city level, the foreign-born share, and the 2026 supplement had not been released when this was written.
Where this data goes quiet
Anything below the borough. Why anyone moved. Anyone who left the country. What a leaver’s household earned or owned before the move. Infants, since the question is asked of people one and over. Second homes and part-year residents, who answer from wherever they are on the survey day. Which of the arrivals from abroad came through the shelter system. Whether the people who left in 2021 came back, since each year is a fresh sample. And the year 2025 in the census, which is not yet published.
Under the hood: data, definitions, estimators and the full results
This is the methods note for everything above. It is deliberately more technical than the rest.
The published anchor. Census table B07001 (geographical mobility in the past year by age, population one year and over) for New York city from the one-year survey: 2019 from the Bureau’s sequence-format summary file (sequence 18, start position 7), 2021 to 2023 from the table-based summary files, 2024 from the Census Reporter mirror. Five rows are reproduced: same house, moved within the same county, moved from a different county in the same state, moved from a different state, moved from abroad. In the microdata these are, respectively, residence-one-year-ago code 1; code 3 with a New York migration PUMA equal to the resident’s own borough; code 3 with any other New York migration PUMA, which includes the other boroughs; code 3 with a migration state among the fifty states and DC other than New York; and code 2, or code 3 with a migration state outside the fifty states and DC, so that Puerto Rico and the island areas count as abroad, as the table defines them.
Residents. The 2015 to 2024 one-year public-use microdata samples for New York, cut to the 55 microdata areas of the five boroughs and to people one and over with a residence-one-year-ago answer: 66,000 to 70,000 person records a year, with 80 replicate weights, joined to their housing records for household income, tenure, household size and the presence of children. Group quarters residents are kept for every count and rate and dropped from household measures.
Leavers. The national one-year person files (about 3.3 million records a year, two CSV members, read in place from the zip) filtered to migration state 36 and a five-borough migration PUMA: 3700, 3800, 3900, 4000 and 4100 in the 2010 geography used through 2021 (the Bronx, Manhattan, Staten Island, Brooklyn and Queens), and 4100 to 4500 in the 2020 geography from 2022 (Manhattan, the Bronx, Brooklyn, Queens, Staten Island). Both code lists were checked against the state file, where the modal migration PUMA of each borough’s within-city movers is the code above. Records whose current microdata area is also in the city are within-city moves and are excluded from the leavers; the rest, 2,800 to 4,200 records a year, are joined to the national housing file on the household serial number. The 2015 to 2018 files carry the older variable names, translated code for code.
Origins and destinations. For arrivals, the migration state or country and migration PUMA a year earlier; a migration PUMA is placed in the metro suburbs through the IPUMS composition files that list the microdata areas each migration PUMA contains, taking the majority region of those areas. For arrivals from abroad, the migration state/country code gives the country or region of residence a year ago; the census releases many countries only as regions (“South Central Asia, not specified”, “Western Africa, not specified”), which is why the chart groups by region and the text names only the countries the code names. Region of birth, from the place-of-birth code, is kept as a second view. For leavers, the current state and microdata area, with the same four suburban regions identified through the study-area geography; other states are grouped by census region with Florida, Pennsylvania, California and Texas shown separately. People now in Puerto Rico are in a separate file and not read.
Derived variables. Household income is the housing record’s total income times the Bureau’s within-year factor and the New York-metro CPI to 2024 dollars, measured in the household the person lives in at the survey. Degree is a bachelor’s or higher among people 25 and over; employment among 16 and over; enrolment among 18 and over. Race and ethnicity are Hispanic of any race, otherwise the census’s single race. Foreign-born is nativity code 2; non-citizen is citizenship code 5. With children means someone under 18 in the household; owner means tenure 1 or 2. Regions group the codes: 100 to 199 Europe, 200 to 299 Asia, 300 to 359 the Caribbean, Mexico and Central America, 360 to 399 South America, 400 to 499 Africa, the rest Canada, Oceania and elsewhere; for residence a year ago, codes below 100 are Puerto Rico and the island areas. A leaver still works in the city if their place-of-work state is New York and their place-of-work area is one of the five borough codes.
Estimators. For any statistic computed with the full weight, the same statistic is recomputed with each of the 80 replicate weights and the variance is the Bureau’s successive-difference estimator, four-eightieths of the summed squared deviations of the replicate estimates from the full-weight one; margins are 90%, or 1.645 standard errors. A net flow is the difference of two weighted counts computed replicate by replicate, so its margin accounts for both sides; residents and leavers of a year come from the same survey with the same replicate weights, which is what makes that legitimate. The out-migration rate is a weighted share with the same margin. Medians are weighted medians without a margin. A published row is reproduced if the difference is within the root of the summed squared margins, the Bureau’s test for a difference between two estimates; the full sample and its public-use subsample are not independent, so this is a convention rather than an exact test. Chart cells resting on fewer than 30 records, or rates on fewer than ten leaver records, are labelled too thin rather than drawn.
The ledger, the returns and the two 2026 series. Population estimates are the five counties summed from the Bureau’s county files, July to July, Vintage 2020 for 2011 to 2020 and Vintage 2025 for 2021 to 2025; the Vintage 2025 row for 2020 covers April to July and is not used. IRS county migration totals are each county’s “total migration, US and foreign” row less the flows to and from the other four counties; average income is adjusted gross income per return in nominal dollars; the state lists exclude the IRS’s “other flows” aggregates of suppressed small pairs. The shelter census is the daily DHS report averaged by month. The monthly survey’s foreign-born share is naturalised citizens plus non-citizens among all residents of the five counties, weighted by the final person weight, pooled by period with a margin from the spread of the monthly estimates, which understates the true error because consecutive months share three quarters of their sample.
Does it reproduce? Every row of the 2021 to 2024 tables lands inside the published margin; in 2019 two rows land inside the margin on the difference and three inside the published margin. The year-by-year comparison is the reproduction table.
The series. Leavers: 296,738 in 2015, 316,900 in 2019, 407,600 in 2020, 449,734 in 2021, 387,853 in 2022, 314,096 in 2023, 296,174 ± 19,000 in 2024. Domestic arrivals: 160,238, 170,411, 151,616, 184,182, 204,067, 194,964 and 183,414. Arrivals from abroad: 94,555, 87,696, 63,847, 54,094, 83,595, 106,036 and 97,518. Net domestic: −136,500 ± 20,400 in 2015, −146,500 in 2019, −265,600 ± 26,100 in 2021, −112,800 ± 24,800 in 2024. Out-migration rate: 3.50%, 3.82%, 5.24% and 3.52%.
Who. In 2024 the net domestic flow by age was −29,000 (under 18), +2,000 (18 to 24), −18,000 (25 to 34), −26,000, −27,000 and −15,000 (65 and over); US-born −73,000, foreign-born −40,000; graduates −32,000, non-graduates −53,000. Classified by the household people live in now: −14,000, −21,000, −31,000, −22,000, −6,000, −8,000 and −13,000 up the seven income bands; owner-occupied homes −96,000 and rented −19,000 ± 19,000; with children −68,000, without −47,000. Out-migration rates ran from 1.5% at 65 and over to 6.8% at 18 to 24. Domestic arrivals: median age 27, 65.2% aged 18 to 34, 72.1% of adults with a degree, median household income now 110,358; stayers: 40, 22.7%, 40.9%, 80,912; by residence a year ago, 32.3% Asia, 22.9% the Caribbean, Mexico and Central America, 17.8% South America, 15.7% Europe, 9.7% Africa, 0.6% Puerto Rico and the island areas. Suburban leavers: 57.7% now in owner-occupied homes, 46.1% now with children, 46.5% of the employed still working in the city.
Rerunning it. The analysis script computes every figure and number above, the charts and the dashboard in one run from a fixed seed; its docstring is the long-form method, and the leaver extraction from the national files is a separate script named there. The companion dataset is the census records themselves: the 217,000 residents and leavers in the 2015, 2019 and 2024 files, with their survey weights and the derived variables, so a weighted count of the status column within a year reproduces the headline flows.
Sources
- U.S. Census Bureau — Geographical Mobility in the Past Year (B07001), New York city, ACS 2024 1-year (ACS 2024 1-year tables, released 11 September 2025; the 1-year PUMS followed on 4 December 2025) — 8,387,686 residents one year and over; 143,496 lived in a different state a year earlier and 98,492 abroad; the anchor reproduced from the microdata
- U.S. Census Bureau — the same table for 2019, 2021, 2022 and 2023 (1-year summary files) (ACS 2019, 2021, 2022 and 2023 1-year summary files) — 121,898 arrivals from another state and 85,164 from abroad in 2019; no one-year table was published for 2020
- U.S. Census Bureau — ACS 2015–2024 1-Year PUMS, New York state files (residents) and United States files (leavers), with replicate weights (ACS 2015–2024 1-year releases; the 2020 file is the experimental release) — every count, share and margin labelled census; leavers are found by their migration PUMA a year earlier in the national person file; country of residence a year ago from the migration state/country code
- U.S. Census Bureau, Population Division — County Population Totals and Components of Change, Vintage 2025 (2020–2025) and Vintage 2020 (2010–2020) (Vintage 2025, released March 2026; Vintage 2020, released 2021) — births, deaths, net domestic and net international migration for the five counties, July to July; in the year to July 2025, natural change +36,101, net international migration +65,824, net domestic migration −113,718, population change −12,196
- NYC Department of City Planning — New York City's Population Estimates and Trends, July 2026 release (July 2026, on the Vintage 2025 estimates) — 8,585,000 residents on 1 July 2025; the July 2024 estimate revised from 8,478,000 to 8,597,000 on higher net international inflows; 8,804,000 counted in the 2020 census
- Internal Revenue Service, Statistics of Income — county-to-county migration data, filing years 2015–16 to 2022–23 (2022–23 release, March 2026, the latest available) — returns, exemptions and adjusted gross income for every county pair; flows between the five boroughs removed
- NYC Department of Homeless Services — DHS Daily Report (NYC Open Data) (daily census to 9 September 2026) — people in the DHS shelter system: 45,000 in March 2022, a peak monthly average of 89,000 in November 2023, 84,000 in September 2026
- Office of the Mayor of New York City — press release on the closure of the asylum arrival center, 2 July 2025 (2 July 2025) — more than 237,000 asylum seekers through the city's care since spring 2022; about 69,000 in care at the January 2024 peak, under 37,000 in July 2025; weekly arrivals from about 4,000 in May 2023 to under 100
- U.S. Census Bureau and Bureau of Labor Statistics — Current Population Survey basic monthly public-use files, June 2024 to August 2026 (monthly files to August 2026; no October 2025 file) — the foreign-born and non-citizen shares of residents of the five boroughs, month by month
- Office of the New York State Comptroller — Taxpayer Migration dashboard, tax years 2015–2024 (July 2026, tax year 2024) — state-level context: 134,913 part-year filers left New York State in 2024 and 121,251 arrived, a net loss of 13,662 taxpayers, a net migration rate of −0.14%; married filers earning $100,000 to $500,000 were the largest net-loss group, and the net out-migration rate was highest, about 1%, among filers above $500,000
- IPUMS USA — 2010 and 2020 PUMA to Migration PUMA composition files (2010 and 2020 geography files) — which migration PUMAs make up the metro suburbs, so an arrival can be placed as coming from Long Island, the Lower Hudson Valley, northern New Jersey or southwestern Connecticut