
New York has never had more jobs. Whether that is good news depends on which job you hold, and on whether you live in the city or ride in. The record payroll count is real, but a New Yorker deciding whether a career here still pays, an employer wondering where the workers went, or anyone who has watched a hospital, a warehouse or a home-care agency replace the factory and the typing pool on their block is asking a different question: what has the city’s work become, and who is it working for?
Two official counts sit behind the answer, and they count different things. Every month a sample of employers tell the Bureau of Labor Statistics how many people are on their payrolls in the five boroughs, wherever those people live. Every year the census asks a sample of the city’s residents what they do, wherever they do it. Neither says who holds which jobs, what they earn or how any of it compares with 1990. The microdata behind the census does, for the residents, and the same records for the metro area show who fills the jobs located in the city. So this article reads the payroll count for the jobs, the census for the people back to 1990, and the monthly household survey for 2026. Every chart is interactive, and the records and code are at the end.
Four point nine million jobs, four point two million workers
The payroll count, which is not seasonally adjusted, reached a series high of 4.9 million jobs in July 2026, and the shape of those jobs is what has changed most. Health care and social assistance is now the largest sector by a wide margin, past a million jobs; in 1990 it was a third that size, and finance was larger. The chart below shows the whole thirty-six years at once: the widening blue band at the bottom is care.
Four decades of the city's payrolls, sector by sector
Survey estimate An estimate from an official sample survey read without its microdata or replicate weights: the Bureau of Labor Statistics’ monthly survey of employers (benchmarked each year to unemployment-insurance records, with the latest months preliminary), or the monthly household survey pooled by period. It carries sampling error that the publisher estimates separately; no margin is drawn here, and month-to-month wiggles are mostly noise.Payroll jobs located in the five boroughs by sector, annual averages, 1990 to 2026
The interactive chart needs JavaScript; its numbers are in the table below.
How to read this, and what it cannot show
Each band is one sector’s annual average of Payroll jobs (Current Employment Statistics) Every month the Bureau of Labor Statistics asks a large sample of employers how many people were on their payrolls in the pay period including the 12th, and publishes the count by industry for states and metropolitan areas, including New York city on its own. A job is counted where it is located, whoever holds it and wherever they live; a person with two jobs is counted twice; the self-employed, unpaid family workers and farm workers are not counted at all.It is the count in the news every month, benchmarked each year to unemployment-insurance records. It carries no sampling margin in the published form and, not seasonally adjusted, dips every summer and peaks every December, so months are compared with the same month of another year. , stacked, with the largest sector at the bottom; the dashed line marks 2026 to date. Jobs are counted where they are located, whoever holds them; government includes public schools and hospitals, so it is larger than the census’s public-administration industry below. A survey of employers, benchmarked each year to unemployment-insurance records; its sampling error is published separately and is not drawn here. Hover a band for its first and latest values.
Bureau of Labor Statistics Current Employment Statistics for New York city, not seasonally adjusted, annual means of the published months; 2026 is the January-to-August mean, and its latest month is preliminary. Government includes public schools and hospitals.
The numbers behind this chart
| Sector | 1990 | 2000 | 2010 | 2020 | 2026 |
|---|---|---|---|---|---|
| Construction | 114,500 | 120,500 | 112,500 | 138,900 | 136,600 |
| Manufacturing | 265,300 | 176,800 | 76,300 | 52,900 | 50,400 |
| Wholesale trade | 179,500 | 153,500 | 136,600 | 121,600 | 131,900 |
| Retail trade | 263,600 | 281,800 | 302,800 | 287,200 | 295,600 |
| Transportation, warehousing and utilities | 154,600 | 133,900 | 119,500 | 128,300 | 148,300 |
| Information | 170,500 | 188,000 | 166,600 | 207,900 | 220,000 |
| Financial activities | 521,200 | 487,800 | 427,300 | 471,100 | 520,500 |
| Professional and business services | 468,400 | 587,400 | 575,300 | 711,000 | 799,200 |
| Educational services | 111,700 | 142,200 | 191,500 | 239,900 | 263,400 |
| Health care and social assistance | 375,200 | 486,400 | 580,200 | 769,900 | 1,020,500 |
| Leisure and hospitality | 218,400 | 257,700 | 323,100 | 275,700 | 443,400 |
| Other services | 124,800 | 147,400 | 160,600 | 162,500 | 175,500 |
| Government | 607,100 | 572,800 | 582,100 | 597,800 | 629,900 |
The census counts 4.2 million employed residents in 2024. The two numbers are not in conflict, because they measure different things: one counts jobs at the employer’s address, wherever the worker lives; the other counts each working resident once, at home, and includes the self-employed, most of whom fall outside the payroll survey’s scope. The commuters who account for much of the gap get their own section below.
Before going further, a check. The published table’s fourteen industry rows and eight occupation groups all reproduce from the microdata within the published margin; the comparison is in the Reproduce box below. From here on, every number is one the tables do not print.
What the city’s residents do
Sort the working residents by industry and the largest group is the one the payroll count found: 18% work in health care and social assistance, ahead of professional and business services and of education. Finance, insurance and real estate, the industries the city is known for, employ fewer residents than the arts, restaurants and hotels do. And the lines have been moving in the same directions for three decades: care and professional work climbing, manufacturing and finance sliding.
What the city's residents do, by industry
Microdata estimate Tabulated directly from survey microdata, with no model in between: every variable in the chart is observed in the same record, so the relationship shown is measured rather than modelled. It is still an estimate from a sample, not a count of everyone, and the ticks are 90% margins from the survey’s replicate weights.Employed residents of the five boroughs by industry group, 1990 to 2024
The interactive chart needs JavaScript; its numbers are in the table below.
How to read this, and what it cannot show
One line per Industry and occupation groups across three decades The census has changed its industry and occupation codes three times since 1990: the 1990 census used its own scheme, the 2000 census a new one, and the American Community Survey a NAICS-based industry code and a Standard Occupational Classification code that were both revised again in 2018. Fourteen industry groups and eight occupation groups are used here that each scheme can be mapped to without splitting a code.Two seams remain: publishing was manufacturing in 1990 and information from 2000, and social services were a 1990 heading of their own and are health care and social assistance from 2000. The monthly household survey and the payroll count use coarser groups again, combining wholesale with retail and, for the survey, education with health. , through the 1990, 2000, 2010, 2019 and 2024 census files, spaced by year. Ticks are 90% margins from 2010 on; the 1990 and 2000 points come from the 5% census samples and carry none. Hover a line for every year’s figure, or a name to pick it out. Civilian employed residents 16 and over, by the industry of their main job.
Civilian employed residents 16 and over, by the industry of their main job, harmonised across the 1990 census codes and the NAICS-based codes used from 2000; the methods note names the seams. 1990 and 2000 are the decennial 5% samples, for which no margin is calculated; 2010, 2019 and 2024 are one-year ACS files with replicate-weight margins.
The numbers behind this chart
| Group | 1990 | 2000 | 2010 | 2019 | 2024 |
|---|---|---|---|---|---|
| Agriculture and mining | 0.3% | 0.1% | 0.1% ± 0.0% | 0.1% ± 0.0% | 0.1% ± 0.0% |
| Construction | 4.1% | 4.2% | 5.1% ± 0.3% | 5.4% ± 0.3% | 4.8% ± 0.3% |
| Manufacturing | 11% | 6.6% | 4.1% ± 0.2% | 3.1% ± 0.2% | 2.7% ± 0.2% |
| Wholesale trade | 4.1% | 3.1% | 2.3% ± 0.2% | 2.2% ± 0.2% | 1.6% ± 0.2% |
| Retail trade | 9.2% | 9.1% | 9.9% ± 0.3% | 8.7% ± 0.3% | 8.2% ± 0.4% |
| Transportation, warehousing and utilities | 7.6% | 6.5% | 5.8% ± 0.3% | 6.4% ± 0.3% | 6.6% ± 0.3% |
| Information | 1.8% | 5.3% | 3.8% ± 0.2% | 3.9% ± 0.2% | 3.9% ± 0.2% |
| Finance, insurance and real estate | 13% | 11% | 9.9% ± 0.3% | 9.3% ± 0.3% | 8.8% ± 0.3% |
| Professional, management and administrative services | 11% | 12% | 12% ± 0.3% | 14% ± 0.4% | 17% ± 0.5% |
| Educational services | 8.0% | 8.6% | 9.0% ± 0.3% | 9.5% ± 0.3% | 9.9% ± 0.3% |
| Health care and social assistance | 13% | 15% | 17% ± 0.5% | 18% ± 0.4% | 18% ± 0.4% |
| Arts, entertainment, hotels and restaurants | 7.2% | 8.3% | 10% ± 0.4% | 11% ± 0.3% | 9.4% ± 0.4% |
| Other services | 4.7% | 5.8% | 6.0% ± 0.3% | 4.8% ± 0.2% | 5.1% ± 0.3% |
| Public administration | 4.8% | 4.5% | 4.2% ± 0.2% | 3.7% ± 0.2% | 3.8% ± 0.3% |
Sort them by what they do rather than where, and the city is a professional town. Professional jobs, in computing, engineering, science, law, teaching, the arts and health care, are the largest group at 29%, and with management jobs they outnumber service jobs by more than two to one. Who does the work matters as much as what it is. Health care’s workers are mostly women and half were born abroad; construction’s are mostly men and two thirds born abroad. Information and finance have the most graduates and the highest pay, with a median around $107,000 in finance, insurance and real estate in 2024; health care, the biggest industry, sits below the city median.
Who does the work
Microdata estimate Tabulated directly from survey microdata, with no model in between: every variable in the chart is observed in the same record, so the relationship shown is measured rather than modelled. It is still an estimate from a sample, not a count of everyone, and the ticks are 90% margins from the survey’s replicate weights.Employed residents with each trait, by industry or occupation, 1990 to 2024
The interactive chart needs JavaScript; its numbers are in the table below.
How to read this, and what it cannot show
One line per trait, through the five census files; no margin is calculated for the 1990 and 2000 samples. Degree among workers 25 and over; works in Manhattan and in the five boroughs among workers who do not usually work from home and report a workplace; works from home among workers at work in the survey week, the only ones the census asks how they get to work; 35 hours or more is usual weekly hours in the earnings year. The chart opens on all employed residents.
Degree among workers 25 and over; works in Manhattan and in the five boroughs among workers who do not usually work from home and report a workplace (the census records a home worker's workplace as their home); works from home is the usual means of getting to work. Pick an industry or an occupation group.
The numbers behind this chart
| Group | 1990 | 2000 | 2010 | 2019 | 2024 |
|---|---|---|---|---|---|
| Women | 48% | 48% | 49% ± 0.4% | 50% ± 0.3% | 50% ± 0.3% |
| Born abroad | 34% | 43% | 46% ± 0.5% | 44% ± 0.6% | 43% ± 0.6% |
| Bachelor's degree or higher (25+) | 32% | 38% | 41% ± 0.6% | 48% ± 0.6% | 52% ± 0.6% |
| Self-employed | 8.6% | 8.9% | 9.9% ± 0.3% | 8.9% ± 0.3% | 10% ± 0.4% |
| Government employee | 18% | 16% | 14% ± 0.3% | 13% ± 0.4% | 13% ± 0.4% |
| Works in Manhattan | 47% | 47% | 47% ± 0.6% | 48% ± 0.6% | 46% ± 0.6% |
| Works in the five boroughs | 90% | 89% | 92% ± 0.3% | 93% ± 0.3% | 93% ± 0.3% |
| Works from home | 0.5% | 0.5% | 4.2% ± 0.2% | 4.6% ± 0.3% | 12% ± 0.3% |
| Works 35 hours or more | 81% | 80% | 82% ± 0.4% | 81% ± 0.4% | 79% ± 0.5% |
| Aged 55 and over | 15% | 13% | 18% ± 0.3% | 20% ± 0.3% | 23% ± 0.3% |
Thirty years of change
Put the 1990 census beside the 2024 one and the same city has a different workforce. There are nine hundred thousand more employed residents, and manufacturing, 11% of workers in 1990 on the mapping used here and no less than 9% on any other, is now one worker in forty. The occupations changed more than the industries: office and administrative support, the largest group in 1990 with one worker in five, is one in ten now, and professional and management jobs went from a third of the workforce to nearly half. The typist, the clerk and the machine operator gave way to the analyst, the nurse and the home health aide, and the five grids below show the swap happening decade by decade.
A hundred working New Yorkers
Microdata estimate Tabulated directly from survey microdata, with no model in between: every variable in the chart is observed in the same record, so the relationship shown is measured rather than modelled. It is still an estimate from a sample, not a count of everyone, and the ticks are 90% margins from the survey’s replicate weights.Employed residents of the five boroughs as 100 squares, by occupation group
The interactive chart needs JavaScript; its numbers are in the table below.
How to read this, and what it cannot show
Each grid is one census year and each square one per cent of the city’s employed residents, rounded so the squares add to a hundred; the table below gives the unrounded shares, and the occupation chart in the questions carries their margins. Eight groups harmonised across the 1990 and 2000-onward coding schemes; the methods note gives the mapping.
Each square is one per cent of employed residents in the year chosen, rounded so the squares add to 100 (largest remainders). Census 5% samples for 1990 and 2000, one-year ACS files for 2010, 2019 and 2024; the occupation chart in the questions below carries the margins.
The numbers behind this chart
| Occupation group | 1990 (of 100) | 2000 (of 100) | 2010 (of 100) | 2019 (of 100) | 2024 (of 100) |
|---|---|---|---|---|---|
| Management, business and finance | 14 | 13 | 14 | 17 | 19 |
| Professional (computing, engineering, science, law, teaching, arts, health) | 20 | 23 | 24 | 26 | 29 |
| Service (health support, protective, food, cleaning, personal care) | 16 | 18 | 23 | 23 | 21 |
| Sales | 10 | 11 | 11 | 9 | 8 |
| Office and administrative support | 21 | 17 | 13 | 10 | 10 |
| Construction, extraction, farming, installation and repair | 5 | 6 | 6 | 6 | 5 |
| Production | 7 | 6 | 3 | 2 | 2 |
| Transportation and material moving | 7 | 6 | 6 | 7 | 6 |
The workers changed with the work. Among workers 25 and over, a third held a bachelor’s degree in 1990 and 52% did in 2024. More were born abroad, and far more were past their mid-fifties. One might expect a workforce transformed this far toward graduate and professional work to show a similar rise in what a typical worker takes home. It does not.
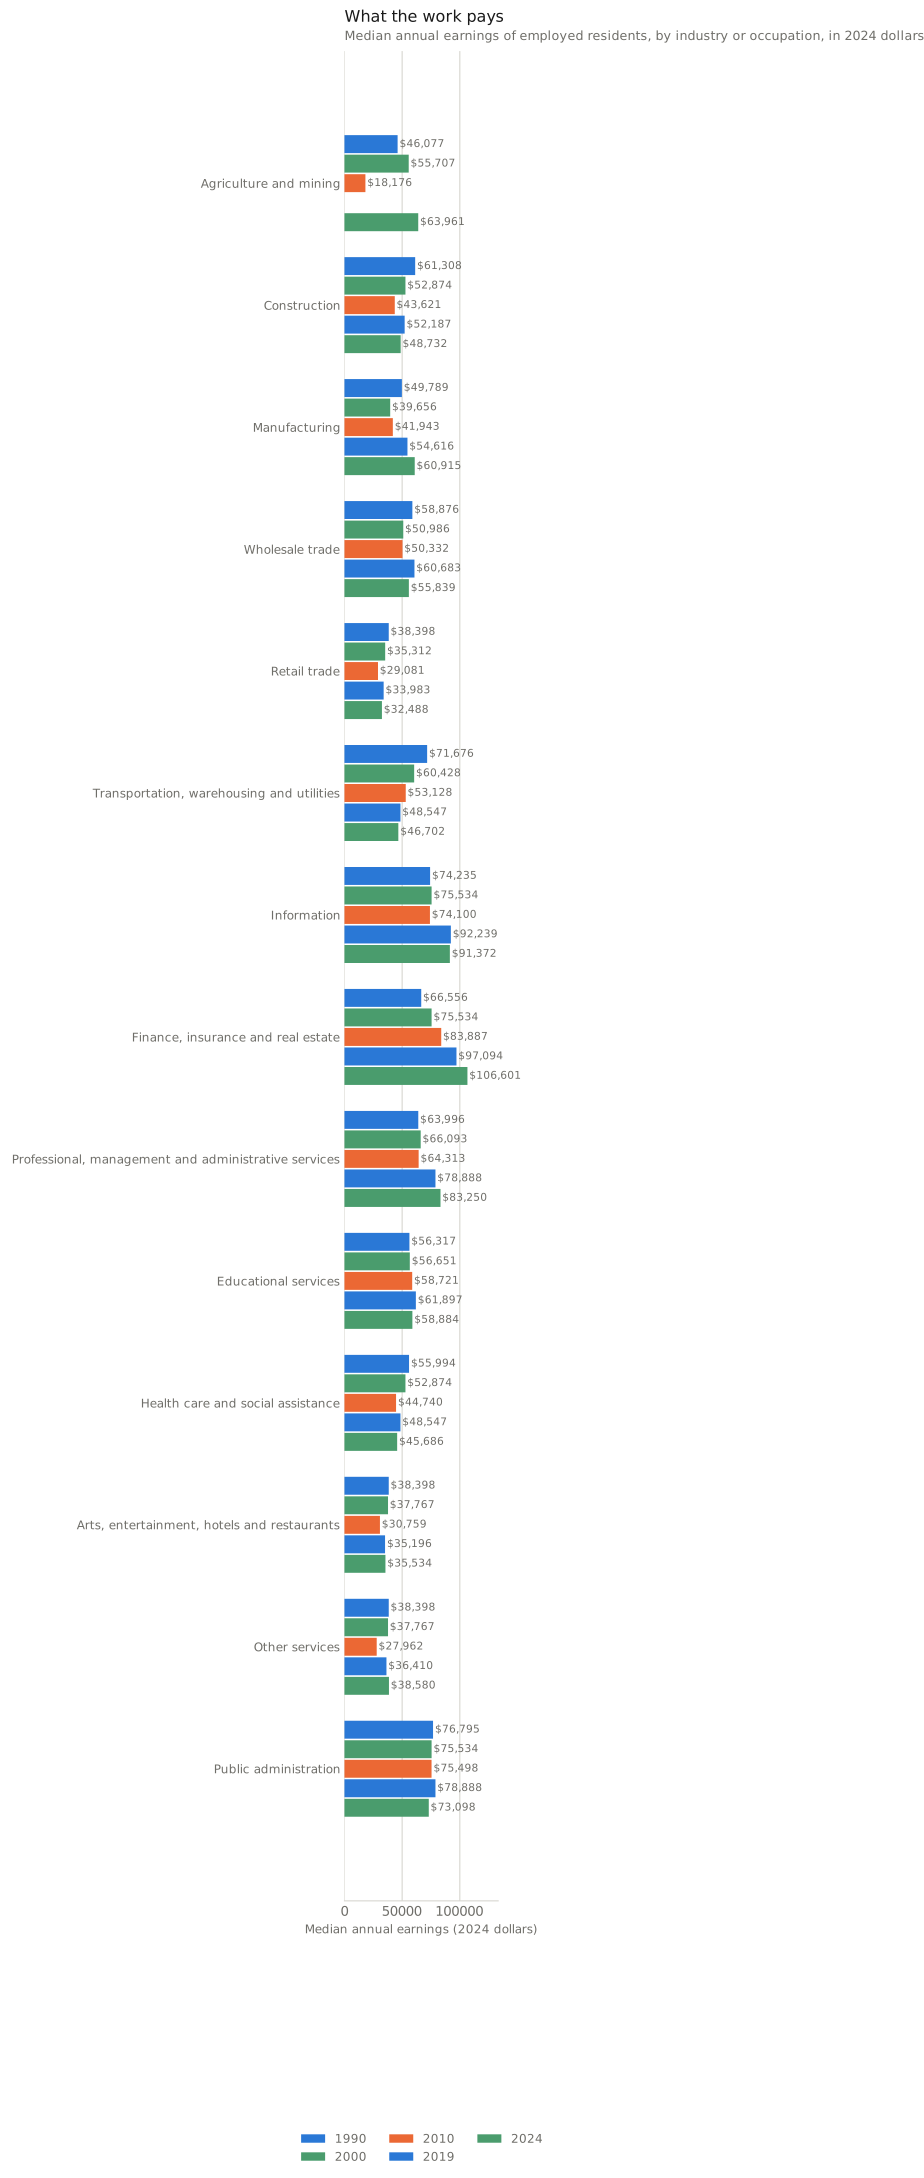
Across everyone with earnings, the median resident made about the same in 2024 as in 1990, in today’s dollars, around $55,000. That figure mixes pay with how much people work, so compare like with like: among full-time, full-year workers, the median rose from about $69,000 to $71,000, a few per cent in thirty-four years on the New York-metro price index, and about 7% on the national research series the Census Bureau uses. Either way, a workforce far more educated and professional than in 1990 earns, in the middle, surprisingly little more than its 1990 counterpart did.
The average hides a split, and the split is the point. The fields that grew at the top, finance, information and professional services, pulled well ahead, while health care, retail, construction and transport slipped. In the city’s largest sector, the median full-time, full-year worker earns slightly less than in 1990, partly because lower-paid service occupations, home health aides among them, grew from 31% of its workers to 42%; the sector’s professionals earn what they did.
What the work paid in 1990, and what it pays now
Microdata estimate Tabulated directly from survey microdata, with no model in between: every variable in the chart is observed in the same record, so the relationship shown is measured rather than modelled. It is still an estimate from a sample, not a count of everyone, and the ticks are 90% margins from the survey’s replicate weights.Median annual earnings of employed residents, 1990 and 2024, in 2024 dollars
The interactive chart needs JavaScript; its numbers are in the table below.
How to read this, and what it cannot show
The hollow dot is 1990 and the filled dot 2024, blue where the median rose and orange where it fell. Full-time, full-year means usual hours of 35 or more and 50 to 52 weeks worked in the earnings year, which holds work intensity roughly constant; switch to everyone with earnings to see the headline medians. An industry’s median moves with the kinds of job inside it, so a fall is not proof that the same job pays less. The 1990 census asked about earnings received in 1989, converted here with the 1989 New York-metro price index. Several 1990 groups share a median because earnings in the old census were reported in round amounts.
Own wage, salary and self-employment earnings in the income year among employed residents with positive earnings, in 2024 dollars (New York-metro CPI; the 1990 census asked about 1989). Full-time, full-year: usual hours of 35 or more and 50 to 52 weeks worked in that year. Medians of an industry mix pay with the kinds of job inside it, so a falling industry median need not mean lower pay for the same job. Several 1990 groups share a median because earnings in the old census heap on round amounts. Groups with fewer than 100 records in either year are not drawn.
The numbers behind this chart
| Group | 1990 | 2024 |
|---|---|---|
| Everyone with earnings: Agriculture and mining | $46,077 | $63,961 |
| Everyone with earnings: Construction | $61,308 | $48,732 |
| Everyone with earnings: Manufacturing | $49,789 | $60,915 |
| Everyone with earnings: Wholesale trade | $58,876 | $55,839 |
| Everyone with earnings: Retail trade | $38,398 | $32,488 |
| Everyone with earnings: Transportation, warehousing and utilities | $71,676 | $46,702 |
| Everyone with earnings: Information | $74,235 | $91,372 |
| Everyone with earnings: Finance, insurance and real estate | $66,556 | $106,601 |
| Everyone with earnings: Professional, management and administrative services | $63,996 | $83,250 |
| Everyone with earnings: Educational services | $56,317 | $58,884 |
| Everyone with earnings: Health care and social assistance | $55,994 | $45,686 |
| Everyone with earnings: Arts, entertainment, hotels and restaurants | $38,398 | $35,534 |
| Everyone with earnings: Other services | $38,398 | $38,580 |
| Everyone with earnings: Public administration | $76,795 | $73,098 |
| Everyone with earnings: Management, business and finance | $81,915 | $101,525 |
| Everyone with earnings: Professional (computing, engineering, science, law, teaching, arts, health) | $76,795 | $81,220 |
| Everyone with earnings: Service (health support, protective, food, cleaning, personal care) | $40,957 | $31,067 |
| Everyone with earnings: Sales | $52,669 | $36,955 |
| Everyone with earnings: Office and administrative support | $51,197 | $47,920 |
| Everyone with earnings: Construction, extraction, farming, installation and repair | $63,996 | $45,686 |
| Everyone with earnings: Production | $38,398 | $40,610 |
| Everyone with earnings: Transportation and material moving | $46,077 | $39,595 |
| Full-time, full-year: Agriculture and mining | $63,996 | – |
| Full-time, full-year: Construction | $74,235 | $55,839 |
| Full-time, full-year: Manufacturing | $61,436 | $71,068 |
| Full-time, full-year: Wholesale trade | $66,556 | $65,991 |
| Full-time, full-year: Retail trade | $56,317 | $48,732 |
| Full-time, full-year: Transportation, warehousing and utilities | $76,795 | $55,839 |
| Full-time, full-year: Information | $89,595 | $108,632 |
| Full-time, full-year: Finance, insurance and real estate | $76,795 | $119,800 |
| Full-time, full-year: Professional, management and administrative services | $76,795 | $101,525 |
| Full-time, full-year: Educational services | $74,235 | $75,128 |
| Full-time, full-year: Health care and social assistance | $63,996 | $60,915 |
| Full-time, full-year: Arts, entertainment, hotels and restaurants | $51,197 | $44,062 |
| Full-time, full-year: Other services | $50,229 | $50,762 |
| Full-time, full-year: Public administration | $84,475 | $79,190 |
| Full-time, full-year: Management, business and finance | $89,595 | $111,678 |
| Full-time, full-year: Professional (computing, engineering, science, law, teaching, arts, health) | $91,834 | $91,372 |
| Full-time, full-year: Service (health support, protective, food, cleaning, personal care) | $51,197 | $40,610 |
| Full-time, full-year: Sales | $71,676 | $63,961 |
| Full-time, full-year: Office and administrative support | $58,876 | $55,839 |
| Full-time, full-year: Construction, extraction, farming, installation and repair | $76,795 | $50,762 |
| Full-time, full-year: Production | $48,645 | $45,686 |
| Full-time, full-year: Transportation and material moving | $61,436 | $45,686 |
Who fills the city’s jobs
Some of the city’s best-paid work is done by people who do not live in it. Among workers in the metro area who travel to a workplace in the five boroughs, 22% live outside the city. That share is a floor, since commuters from beyond the metro area are in no file here.
The commuters do not hold a cross-section of the city’s jobs. They hold a third of the finance, insurance and real estate jobs, against a sixth in health care, and the median commuter earned about $96,000 in 2024 against $53,000 for the residents working beside them, a gap that holds inside every industry. The census shows that gap only for 2024, so it says who holds the best-paid jobs now, not where the missing growth in residents’ earnings went.
Jobs located in the city, and who holds them
Microdata estimate Tabulated directly from survey microdata, with no model in between: every variable in the chart is observed in the same record, so the relationship shown is measured rather than modelled. It is still an estimate from a sample, not a count of everyone, and the ticks are 90% margins from the survey’s replicate weights.Workers whose workplace is in the five boroughs, by industry, and the share who live outside the city
The interactive chart needs JavaScript; its numbers are in the table below.
How to read this, and what it cannot show
One row per industry and one dot per census year, sorted by 2024; the figure at the right is 2024. Workers in the metro study area who do not usually work from home and whose workplace is in the five boroughs, from the census records; Jobs in the city, from the census The census asks every worker where they work, to the state and a place-of-work area of at least 100,000 people; the five boroughs are each their own area. Reading the records of everyone in the metro study area whose workplace is in the five boroughs gives the census’s own count of jobs located in the city and of the commuters who hold them.It counts people, not jobs: a resident with two jobs is one worker, placed at the main job. Commuters from beyond the study area (Long Island, the Lower Hudson Valley, northern New Jersey and southwestern Connecticut) are not in the files, so the commuter shares are floors, and someone who usually works from home is placed at the employer’s location. counted as people at their main job. The census records a home worker’s workplace as their home address, which is why home workers are left out here. Commuters from beyond the study area are not in the files, so the commuter shares are floors. Hover a dot for its margin.
From the census records of every worker in the metro study area (the five boroughs, Long Island, the Lower Hudson Valley, northern New Jersey and southwestern Connecticut) who does not usually work from home and whose workplace is in the five boroughs. The census records a home worker's workplace as their home address, so home workers are left out of this count. Commuters from beyond the study area are not in the files, so the commuter shares are floors.
The numbers behind this chart
| Group | 2015 | 2019 | 2024 |
|---|---|---|---|
| Agriculture and mining | 4,999 ± 1,338 | – | – |
| Construction | 247,749 ± 12,173 | 273,895 ± 11,552 | 238,965 ± 14,298 |
| Manufacturing | 137,996 ± 7,215 | 129,333 ± 9,460 | 114,101 ± 7,103 |
| Wholesale trade | 104,803 ± 6,448 | 92,745 ± 6,215 | 63,691 ± 6,326 |
| Retail trade | 382,137 ± 13,019 | 365,904 ± 14,982 | 332,639 ± 16,184 |
| Transportation, warehousing and utilities | 282,235 ± 10,848 | 292,283 ± 12,394 | 282,881 ± 13,499 |
| Information | 185,860 ± 9,737 | 193,452 ± 9,609 | 151,498 ± 8,633 |
| Finance, insurance and real estate | 474,828 ± 14,965 | 502,055 ± 16,098 | 422,060 ± 13,306 |
| Professional, management and administrative services | 621,845 ± 18,772 | 663,299 ± 14,732 | 651,743 ± 19,237 |
| Educational services | 403,522 ± 12,644 | 439,025 ± 15,111 | 435,830 ± 15,296 |
| Health care and social assistance | 727,943 ± 20,596 | 778,095 ± 19,524 | 746,523 ± 17,035 |
| Arts, entertainment, hotels and restaurants | 453,650 ± 17,931 | 441,123 ± 14,315 | 376,073 ± 14,890 |
| Other services | 215,336 ± 11,160 | 192,449 ± 9,382 | 195,091 ± 10,397 |
| Public administration | 194,894 ± 11,062 | 202,539 ± 8,708 | 194,319 ± 11,405 |
For the residents, the largest change in where they work is home. In 1990 one worker in two hundred usually worked from home; in 2024 it was 12.5%, one in eight. Among residents who still travel to a workplace, Manhattan’s share has barely changed, 47% in 1990 and 46% in 2024.
Those are two snapshots of different people, not the same workers followed over time, so the steady Manhattan share is a fact about the total, not about anyone’s habits. Working from home is concentrated in professional jobs and in a few neighbourhoods, and the map shows how uneven it is, from a quarter of workers in Park Slope to fewer than one in twenty in parts of the Bronx: the same divide as the pay chart, drawn on the ground.
Where the city's workers live, and where they go
Microdata estimate Tabulated directly from survey microdata, with no model in between: every variable in the chart is observed in the same record, so the relationship shown is measured rather than modelled. It is still an estimate from a sample, not a count of everyone, and the ticks are 90% margins from the survey’s replicate weights.Employed residents of the 55 census neighbourhoods (PUMAs) of the five boroughs, 2024
The interactive chart needs JavaScript; its numbers are in the table below.
How to read this, and what it cannot show
Neighbourhoods are the Census Bureau’s public-use microdata areas, which mostly follow the city’s community districts; each holds a few hundred survey records, so shares carry margins of a few points (hover to see them). The colour classes are equal steps with round edges, and the triangle on the legend marks the whole city. Working from home is measured among workers at work in the survey week, and working in Manhattan among residents who do not usually work from home and report a workplace. Median earnings often tie between neighbourhoods, because people report round amounts and the median lands on one of them.
American Community Survey 2024 one-year microdata, civilian employed residents 16 and over, by the neighbourhood (public-use microdata area, PUMA) they live in. Shares carry 90% replicate-weight margins; medians carry none. Work in Manhattan is computed among residents who do not usually work from home and report a workplace. Shapes: Census Bureau cartographic boundary file, 2020 PUMAs, clipped to the shoreline.
The numbers behind this chart
| Neighbourhood | Borough | Work from home | Work in Manhattan | Work in health care | Median earnings |
|---|---|---|---|---|---|
| Midtown, East Midtown, & Flatiron | Manhattan | 16% ± 3.1% | 87% ± 2.5% | 9.0% ± 2.2% | $116,800 |
| Fordham, Bedford Park, & Norwood | Bronx | 7.1% ± 2.9% | 33% ± 4.9% | 22% ± 4.1% | $35,500 |
| Pelham Parkway & Morris Park | Bronx | 8.0% ± 2.3% | 29% ± 4.7% | 24% ± 3.9% | $44,500 |
| Crown Heights (North) | Brooklyn | 19% ± 3.9% | 48% ± 5.5% | 14% ± 3.9% | $60,900 |
| Co-op City & Throgs Neck | Bronx | 8.0% ± 3.3% | 34% ± 4.8% | 21% ± 3.8% | $50,800 |
| Highbridge & Concourse | Bronx | 3.0% ± 1.6% | 35% ± 5.3% | 24% ± 3.9% | $39,000 |
| Crown Heights (South) | Brooklyn | 16% ± 4.1% | 45% ± 6.2% | 22% ± 4.7% | $60,900 |
| Harlem | Manhattan | 22% ± 4.3% | 82% ± 4.5% | 23% ± 4.0% | $55,800 |
| Bushwick | Brooklyn | 17% ± 3.3% | 55% ± 5.6% | 13% ± 2.9% | $55,800 |
| Washington Heights & Inwood | Manhattan | 12% ± 3.1% | 80% ± 4.1% | 16% ± 3.0% | $45,700 |
| Sunset Park & Windsor Terrace | Brooklyn | 13% ± 3.2% | 41% ± 3.9% | 11% ± 2.2% | $50,800 |
| Morningside Heights & Hamilton Heights | Manhattan | 13% ± 3.7% | 82% ± 5.5% | 15% ± 3.7% | $45,700 |
| Jackson Heights & East Elmhurst | Queens | 6.5% ± 1.9% | 39% ± 4.6% | 11% ± 2.3% | $42,600 |
| Lower East Side & Chinatown | Manhattan | 14% ± 3.3% | 80% ± 4.5% | 14% ± 3.1% | $66,000 |
| Upper East Side & Roosevelt Island | Manhattan | 22% ± 3.3% | 89% ± 2.8% | 15% ± 2.7% | $115,700 |
| South Ozone Park & Howard Beach | Queens | 11% ± 2.8% | 29% ± 5.1% | 21% ± 3.1% | $49,700 |
| Coney Island & Brighton Beach | Brooklyn | 5.1% ± 2.3% | 27% ± 4.7% | 27% ± 5.5% | $45,700 |
| Canarsie & Flatlands | Brooklyn | 9.0% ± 2.0% | 28% ± 3.4% | 31% ± 3.1% | $50,800 |
| Bensonhurst & Bath Beach | Brooklyn | 9.2% ± 2.0% | 27% ± 3.5% | 22% ± 3.3% | $40,600 |
| Flatbush & Midwood | Brooklyn | 13% ± 2.5% | 41% ± 4.8% | 18% ± 3.1% | $50,800 |
| Williamsburg & Greenpoint | Brooklyn | 20% ± 2.7% | 55% ± 4.2% | 10% ± 1.7% | $81,200 |
| Astoria & Queensbridge | Queens | 12% ± 2.1% | 57% ± 3.8% | 14% ± 2.5% | $67,000 |
| Elmhurst & Corona | Queens | 5.5% ± 1.9% | 45% ± 4.1% | 16% ± 3.5% | $38,300 |
| Ocean Hill & Brownsville | Brooklyn | 6.6% ± 3.2% | 31% ± 7.3% | 25% ± 5.0% | $35,500 |
| Morris Heights & Mount Hope | Bronx | 5.3% ± 2.6% | 35% ± 5.8% | 31% ± 5.7% | $30,500 |
| Borough Park & Kensington | Brooklyn | 9.5% ± 2.1% | 21% ± 3.4% | 17% ± 2.8% | $40,600 |
| Downtown Brooklyn & Fort Greene | Brooklyn | 23% ± 4.6% | 65% ± 4.2% | 14% ± 3.1% | $101,500 |
| Queens Village, Bellerose, & Rosedale | Queens | 9.3% ± 2.2% | 25% ± 3.7% | 25% ± 2.9% | $50,800 |
| South Shore | Staten Island | 7.4% ± 2.3% | 22% ± 3.4% | 17% ± 2.9% | $67,000 |
| East New York & Cypress Hills | Brooklyn | 6.8% ± 2.6% | 26% ± 3.9% | 24% ± 3.1% | $40,600 |
| Soundview & Parkchester | Bronx | 4.8% ± 1.8% | 36% ± 5.0% | 24% ± 3.3% | $38,600 |
| Forest Hills & Rego Park | Queens | 18% ± 2.9% | 53% ± 5.3% | 17% ± 3.5% | $73,100 |
| Mid-Island | Staten Island | 10% ± 2.1% | 20% ± 4.3% | 22% ± 4.3% | $60,900 |
| Jamaica, St. Albans, & Hollis | Queens | 7.2% ± 1.8% | 23% ± 2.4% | 26% ± 2.5% | $43,800 |
| East Harlem | Manhattan | 14% ± 4.1% | 81% ± 5.3% | 26% ± 5.1% | $42,600 |
| Bedford-Stuyvesant | Brooklyn | 14% ± 2.9% | 44% ± 3.9% | 16% ± 3.1% | $55,800 |
| Upper West Side | Manhattan | 22% ± 3.2% | 88% ± 3.1% | 11% ± 2.4% | $106,600 |
| Sheepshead Bay & Gravesend (East) | Brooklyn | 12% ± 2.8% | 33% ± 4.5% | 24% ± 4.0% | $50,800 |
| Bay Ridge & Dyker Heights | Brooklyn | 13% ± 2.9% | 31% ± 4.3% | 16% ± 2.7% | $55,800 |
| Long Island City, Sunnyside, & Woodside | Queens | 15% ± 3.6% | 55% ± 4.7% | 8.2% ± 2.1% | $71,100 |
| Kew Gardens, Richmond Hill, & Woodhaven | Queens | 9.2% ± 2.1% | 31% ± 4.0% | 19% ± 2.6% | $46,200 |
| Wakefield, Williamsbridge, & Eastchester | Bronx | 6.1% ± 2.0% | 27% ± 4.0% | 30% ± 3.2% | $48,700 |
| Chelsea & Hell's Kitchen | Manhattan | 23% ± 4.9% | 90% ± 3.6% | 6.6% ± 2.5% | $101,500 |
| Melrose, Mott Haven, Longwood, & Hunts Point | Bronx | 8.8% ± 3.4% | 42% ± 5.2% | 20% ± 5.1% | $30,500 |
| Auburndale, Bayside, & Douglaston | Queens | 11% ± 2.4% | 24% ± 4.5% | 18% ± 3.4% | $60,900 |
| Riverdale, Kingsbridge, & Marble Hill | Bronx | 8.9% ± 2.6% | 45% ± 4.5% | 23% ± 4.2% | $50,800 |
| Ridgewood, Maspeth, & Middle Village | Queens | 13% ± 2.2% | 34% ± 4.2% | 17% ± 2.5% | $55,800 |
| East Flatbush | Brooklyn | 9.8% ± 3.1% | 29% ± 4.4% | 29% ± 3.4% | $45,700 |
| Morrisania, Tremont, Belmont, & West Farms | Bronx | 8.9% ± 2.7% | 36% ± 6.0% | 29% ± 4.4% | $30,500 |
| Financial District & Greenwich Village | Manhattan | 15% ± 3.1% | 89% ± 2.5% | 5.8% ± 2.0% | $121,800 |
| Flushing, Murray Hill, & Whitestone | Queens | 9.6% ± 1.6% | 24% ± 2.7% | 20% ± 2.7% | $40,600 |
| Park Slope & Carroll Gardens | Brooklyn | 25% ± 4.1% | 59% ± 4.5% | 15% ± 4.6% | $101,500 |
| Fresh Meadows, Hillcrest, & Briarwood | Queens | 11% ± 2.6% | 29% ± 5.0% | 24% ± 3.8% | $55,800 |
| North Shore | Staten Island | 5.9% ± 1.7% | 22% ± 3.7% | 19% ± 3.3% | $50,800 |
| The Rockaways | Queens | 9.6% ± 3.2% | 18% ± 5.0% | 25% ± 4.2% | $50,800 |
Since the pandemic, and the answer
The census stops at the 2024 survey. For 2025 and 2026 we switch to the payroll count, which runs to August 2026, and the monthly household survey.
The shutdown took more than 900,000 payroll jobs out of the city in two months of 2020. The count passed its pre-pandemic level in 2023 and set its record in July 2026, but the sectors did not recover together: the net growth since 2019 has been dominated by health care and government, while retail, restaurants and hotels, construction and manufacturing all have fewer jobs than before the pandemic. The record, in other words, is the same story as the thirty years before it, only faster.
Every month of the city's payrolls since 1990
Survey estimate An estimate from an official sample survey read without its microdata or replicate weights: the Bureau of Labor Statistics’ monthly survey of employers (benchmarked each year to unemployment-insurance records, with the latest months preliminary), or the monthly household survey pooled by period. It carries sampling error that the publisher estimates separately; no margin is drawn here, and month-to-month wiggles are mostly noise.Payroll jobs located in the five boroughs, monthly, January 1990 to August 2026
The interactive chart needs JavaScript; its numbers are in the table below.
How to read this, and what it cannot show
The thin line is each month’s payroll count, not seasonally adjusted; the thick line is the average of the latest twelve months, which removes the seasonal swing. The labelled points are placed by rule: the lowest twelve-month average in each downturn, the lowest month of 2020 and the highest month in the series. The latest month is preliminary and will be revised. The sector-by-sector recovery is in the questions below.
Bureau of Labor Statistics Current Employment Statistics for New York city, not seasonally adjusted: the thin line is each month, the thick line the average of the latest 12 months, which removes the seasonal swing. The latest month is preliminary. Annotations are placed by rule: the lowest 12-month average in each downturn window, the lowest month of 2020 and the highest month on record.
The numbers behind this chart
| Annotation | Month | Payroll jobs |
|---|---|---|
| The early-1990s low | May 1993 | 3,283,483 (12-month average) |
| After 2001 | February 2004 | 3,551,908 (12-month average) |
| The Great Recession | March 2010 | 3,722,075 (12-month average) |
| The shutdown | April 2020 | 3,759,200 |
| The record | July 2026 | 4,896,600 |
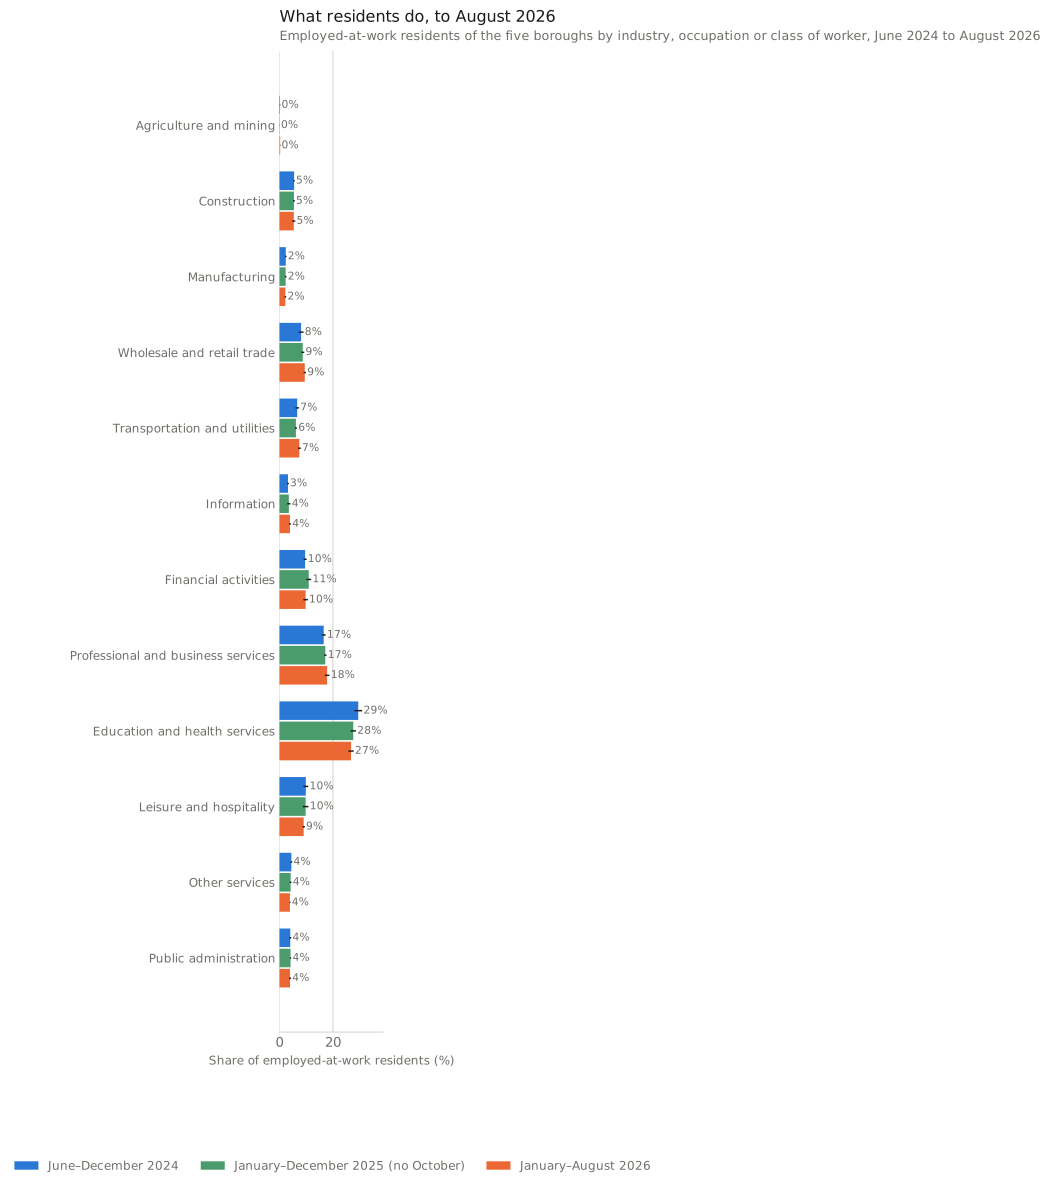
The monthly household survey carries the residents’ side into 2026, with coarser groups, and shows the same order as the 2024 census: 27% of employed residents in education or health, professional and business services next, and about a quarter teleworking at some point in the survey week. That telework figure is not comparable with the census’s one in eight above: the census counts people whose usual way to work is from home, while the household survey counts anyone who teleworked at all that week, hybrid workers included. The survey’s sample is small, and its month-to-month variation is wider than any change in the mix since the census.
Survey estimate An estimate from an official sample survey read without its microdata or replicate weights: the Bureau of Labor Statistics’ monthly survey of employers (benchmarked each year to unemployment-insurance records, with the latest months preliminary), or the monthly household survey pooled by period. It carries sampling error that the publisher estimates separately; no margin is drawn here, and month-to-month wiggles are mostly noise.
How to read this, and what it cannot show
Employed-at-work residents of the five boroughs from the Current Population Survey, pooled by period: June to December 2024, calendar 2025, January to August 2026. The survey’s industry recode combines wholesale with retail and education with health. The ticks show how much the monthly estimates vary within each period, not a formal survey margin, and they understate the uncertainty because adjacent months share most of their sample.
So what do people do in New York? The largest answer is care. Health care and social assistance is the biggest sector in both counts, with by far the largest payroll gain since 1990 and the largest through the pandemic, and nearly one employed resident in five works in it, most of them women and half born abroad. Professional and business services expanded sharply too, and their share of the resident workforce rose a little more than health care’s; behind them stand education, restaurants and hotels.
The stereotypes are not wrong so much as small. Finance employs fewer New Yorkers than the arts, restaurants and hotels, and a third of the city’s finance jobs are held by commuters. What the stereotypes miss is the shrinking of the factory floor and the typing pool, and in their place a workforce in which most workers over 25 hold a degree.
And the middle of it earns surprisingly little more than it did. Median annual earnings for full-time, full-year workers rose only a few per cent in 34 years, in today’s dollars, while the fields at the top pulled away and the field that grew most, care work, fell behind. That is why the record does not feel like one to everyone: the city has more jobs than it has ever had, held by a workforce transformed in what it does, whose real annual earnings, in the middle, have barely kept pace with that transformation.
Cut the data your own way
The dashboard runs on the 319,000 census records of employed residents in 1990, 2000, 2010 and 2024. Pick a year and an industry or occupation, then narrow by borough, nativity, age and earnings, and see how many workers that is, what they earn at the median, how many are women, born abroad or graduates, how many are self-employed or work for government, and how many work in Manhattan or from home.
Employed residents by industry, under the filters above
Loading the census records…
Every number here is a direct weighted tabulation of census microdata records, not a model prediction, so the cross-tabulations it shows are measured relationships within one survey. Their uncertainty is approximated: the headline tile carries an approximate 90% margin: a binomial margin on the record count, scaled by a design effect calibrated on the article's replicate-weight margins (click the ? on the tile). The 1990 and 2000 records come from the 5% census samples, far larger than the one-year files; they are samples too, but carry no replicate weights, so no margin is calculated for them beyond the approximate one on the headline tile.
Year
1990 and 2000 are the decennial census 5% samples (about 125,000 and 132,000 employed city residents each); 2010 and 2024 are one-year American Community Survey files (about 29,000 and 33,000). Each is a fresh sample of different people.
Industry
The industry of the worker's main job, in fourteen groups harmonised across the 1990 census codes and the NAICS-based codes used from 2000. The methods note names the seams (publishing, social services).
Occupation
The occupation group of the main job, in eight groups harmonised across the 1990 and 2000-onward coding schemes. Professional includes computing, engineering, science, law, teaching, arts and media, and health practitioners; service includes health support, protective, food, cleaning and personal care work.
Borough of residence
Where the worker lives, not where the job is. Nothing here goes below the borough.
Nativity
Born abroad means outside the United States and its territories; in 1990 the census item is citizenship, and naturalised citizens and non-citizens are counted as born abroad.
Age
Age at the survey.
Own earnings
The worker's own wage, salary and self-employment earnings in the income year, in 2024 dollars. Workers with no earnings, or negative self-employment earnings, are in no band and drop out when a band is chosen.
Women
The share of the selection who are women. A weighted tabulation of the census records in the selection, with an approximate 90% margin beside it (see the ± button).
Employed residents, weighted estimate
The sum of the survey weights of the records in the selection: the Bureau's estimate of how many workers these records stand for. Rounded to the nearest hundred. A record in a one-year file stands for roughly a hundred people, in a 5% census sample for about twenty.
Median earnings
The median of the workers' own earnings in the selection, in 2024 dollars, interpolated within the earnings band the median falls in, so it is approximate. Workers without positive earnings are excluded.
Born abroad
The share of the selection born outside the United States and its territories.
Hold a degree
Among workers 25 and over in the selection, the share with a bachelor's degree or higher.
Self-employed
The share of the selection who work for themselves, incorporated or not.
Government
The share of the selection employed by federal, state or local government, in any industry: a public-school teacher or a public-hospital nurse counts here, though their industry is education or health.
Work in Manhattan
Among workers who do not usually work from home and report a workplace, the share whose workplace is in Manhattan. The census records a home worker's workplace as their home address, which is why home workers are left out of this share.
Work from home
Among workers at work in the survey week (the census asks how people get to work only of them), the share whose usual means is working from home.
By industry
Each bar is the number of employed residents in one industry group under the filters above (the industry filter itself is ignored here, so the bars always show the whole picture). Groups with fewer than 30 records in the selection are marked too few.
The ± figure
An approximate 90% margin of error on the headline share. The dashboard cannot carry the 80 replicate weights the article's charts use, so it estimates the margin as 1.645 × √(deff × p(1 − p) ÷ n): n is the number of census records in the selection and deff is the design effect, the ratio of the survey's true sampling variance to that of a simple random sample of the same size, calibrated from the article's own chart cells. For the 5% census samples the same formula is applied, which overstates their margin.
Too few workers
Fewer than 30 census records match, so the numbers would be noise. Widen a filter.
Questions this raises
Is the flat median about pay, or about how much people work, or about the price index?
Mostly not about how much people work, and only partly about the index. Annual earnings combine pay with hours, weeks and second jobs, so a population with more part-timers or more part-year workers would show a lower median even if pay per hour held. The census asks usual weekly hours and weeks worked in the same year as earnings, so the comparison can be held roughly steady:
| Employed residents with earnings, 2024 dollars | 1990 | 2024 | Change, NY-metro CPI | Change, R-CPI-U-RS |
|---|---|---|---|---|
| Everyone | $56,317 | $54,824 ± $822 | −3% | +1% |
| Full-time (usual hours 35 or more) | $62,778 | $69,037 ± $1,372 | +10% | +15% |
| Full-time, full-year (and 50 to 52 weeks) | $69,116 | $71,068 ± $550 | +3% | +7% |
The full-time share of workers with earnings fell, from 85% to 79%, which pulls the headline median down; the share working full time all year rose, from 64% to 72%, which pushes it up. The full-time, full-year comparison greatly narrows those differences in work intensity, though it does not remove them: hours above 35 and weeks between 50 and 52 still vary, and annual earnings can come from more than one job. It is not hourly pay, which the census does not ask.
The index matters too. The dollars here use the New York-metro consumer price index, which adjusts the earnings figures for consumer-price inflation in the metropolitan area. The Census Bureau’s own constant-dollar comparisons use the national research series R-CPI-U-RS, which applies today’s methods back to the 1970s and rose less between 1989 and 2024 than the metro index did, so on that series the 1990 medians are lower in 2024 dollars and the changes are about four points higher. The last column gives them. Margins are 90%; the 1990 sample carries no replicate weights, and as a 5% sample its own error is small.
How did the pay of each kind of work change?
Among full-time, full-year workers, in 2024 dollars, finance, insurance and real estate went from about $77,000 in 1990 to $120,000 in 2024, information from $90,000 to $109,000 and professional, management and administrative services from $77,000 to $102,000. Health care went from $64,000 to $61,000, retail from $56,000 to $49,000, construction from $74,000 to $56,000 and transportation and utilities from $77,000 to $56,000. By occupation, management, business and finance rose from $90,000 to $112,000 and professional work stayed near $91,000, while service work fell from $51,000 to $41,000 and production from $49,000 to $46,000.
Inside health care the mix moved. Service occupations, which include home health and personal-care aides, were 31% of the sector’s workers in 1990 and 42% in 2024, and their full-time, full-year median fell from $49,000 to $41,000; the sector’s professionals were at $87,000 in both years. So the sector’s median fell both because low-paid care work grew and because that work pays less in real terms than its 1990 counterpart did. The census’s occupation groups are wide, so part of the second effect may itself be a shift toward lower-paid jobs within the group.
The chart below has the headline medians for all five census years, including the dip in the 2010 file after the last recession.
Microdata estimate Tabulated directly from survey microdata, with no model in between: every variable in the chart is observed in the same record, so the relationship shown is measured rather than modelled. It is still an estimate from a sample, not a count of everyone, and the ticks are 90% margins from the survey’s replicate weights.
How to read this, and what it cannot show
One group of bars per industry or occupation group, five census years. Own earnings in the income year among workers with positive earnings, converted to 2024 dollars with the New York-metro CPI of that income year (1989 for the 1990 census, 1999 for the 2000 census); no margin is drawn.
How well do these numbers match the Bureau’s own?
Closely, and that is the check everything else rests on. The Bureau’s 2024 tables report 4,155,558 employed residents, with 758,008 in health care and social assistance, 697,660 in professional, scientific, management and administrative services, 406,413 in education, 397,766 in arts, entertainment, accommodation and food, 365,935 in finance, insurance and real estate, 339,092 in retail, 266,486 in transportation, warehousing and utilities, 213,801 in other services, 202,222 in construction, 161,490 in information, 160,035 in public administration, 114,719 in manufacturing, 67,333 in wholesale and 4,598 in agriculture and mining. Rebuilding the same rows from the 2024 microdata gives 4,153,819, 759,096, 696,271, 410,077, 391,423, 366,201, 341,233, 273,963, 212,904, 201,316, 162,472, 155,615, 112,983, 66,633 and 3,632, each inside the published Margins of error from replicate weights Each PUMS record carries 80 replicate weights alongside its main weight. A statistic is recomputed 80 times, once with each replicate, and the spread of those 80 answers around the main answer gives its standard error: variance = 4/80 × Σ(θr − θ)². The Census Bureau reports 90% margins, 1.645 standard errors, and every census margin in this article follows that convention.This is the Bureau’s own method (successive difference replication), so a margin here matches what the Bureau would publish for the same cut. ; the eight occupation groups reproduce the same way, from 1,200,581 professional workers published against 1,200,002 rebuilt to 75,285 production workers against 72,962. The full comparison is in the Reproduce box and the reproduction table. The 1990 and 2000 files have no one-year table to check against; their employed totals, 3,246,874 and 3,281,629, match the decennial counts of employed residents to within one percent.
Why are there two counts, and why do they differ?
Because one counts jobs and the other counts people. The payroll count asks a sample of employers in the five boroughs how many people were on their payrolls in the pay period including the 12th of the month, and benchmarks the answers each year to the near-complete unemployment-insurance records: a job is counted where the employer is, whoever holds it and wherever they live, a person with two jobs is counted twice, and proprietors, the unincorporated self-employed, farm workers and unpaid family workers are not counted at all (an owner paid a salary by their own corporation is on its payroll, though the census calls them self-employed). It is a survey, with sampling error the Bureau publishes separately, and its latest months are preliminary. The census asks residents whether they worked in the survey week and what their main job is: a person is counted once, where they live, whatever the job’s location, and the self-employed are included. So the payroll count of 4.85 million in August 2026 and the census count of 4.15 million employed residents in 2024 differ because of the commuters (who add to the payroll count), the second jobs (likewise), the self-employed (about one resident worker in ten, most of whom add to the census count alone), and two different years. The census’s own count of people travelling to workplaces in the city, 4.2 million in 2024, leaves out the half-million residents who usually work from home, whom the census places at their home address rather than their employer’s. Government is the other seam: the payroll count’s government sector, 679,000 jobs in August 2026, includes every public employee, teachers and hospital staff among them, while the census’s public-administration industry, 156,000 residents in 2024, is the civil service alone; a public-school teacher is in education in the census and in government on the payroll.
What does each borough’s workforce look like?
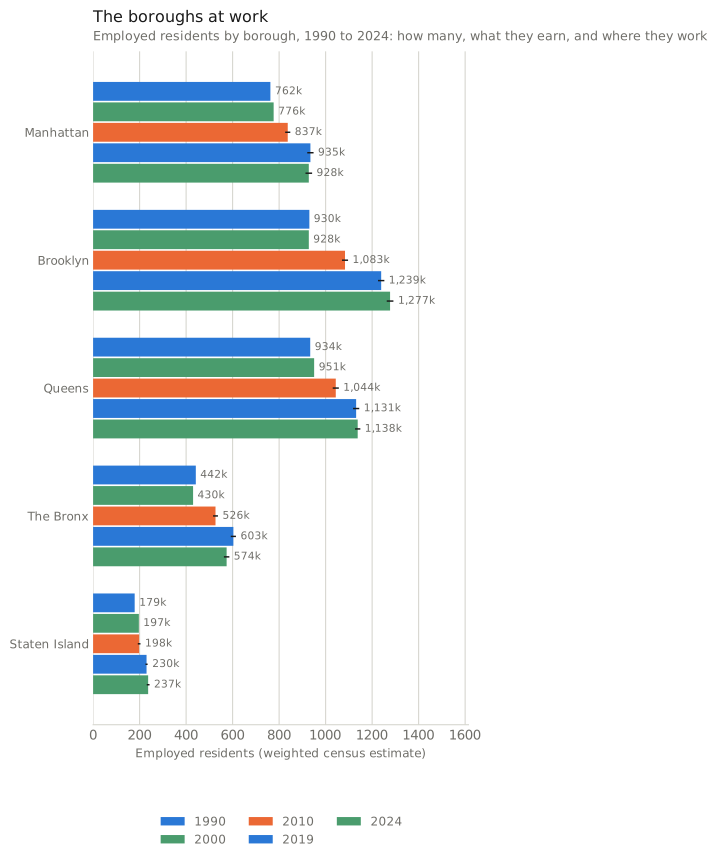
Brooklyn has the most employed residents, about 1,277,000 in 2024, then Queens with 1,138,000, Manhattan with 928,000, the Bronx with 574,000 and Staten Island with 237,000. Health care is the largest industry of residents in every borough except Manhattan, where professional services lead with 24% and finance follows; in the Bronx health care is a quarter of all workers. Median annual earnings run from about $87,000 in Manhattan to $62,000 on Staten Island, $56,000 in Brooklyn, $52,000 in Queens and $41,000 in the Bronx. Working from home in 2024, among workers at work, ran from about a fifth of Manhattan’s to fewer than one in twelve of the Bronx’s and Staten Island’s. The flow chart shows where each borough’s workers go; the borough chart after it has the five census years.
Where each borough goes to work
Microdata estimate Tabulated directly from survey microdata, with no model in between: every variable in the chart is observed in the same record, so the relationship shown is measured rather than modelled. It is still an estimate from a sample, not a count of everyone, and the ticks are 90% margins from the survey’s replicate weights.Employed residents by borough of residence and place of work, 2024
The interactive chart needs JavaScript; its numbers are in the table below.
How to read this, and what it cannot show
Band widths are weighted census estimates; hover or tab to a band for its 90% margin, and click a borough or a destination to isolate its bands. Residents who were employed but not at work in the survey week report no workplace and are left out of the diagram; the table below counts them. For Manhattan residents, working in Manhattan is their own borough and is drawn to Manhattan.
American Community Survey 2024 one-year microdata. Each band is the weighted number of employed residents of a borough by where they usually work; hover for the 90% replicate-weight margin. Residents who were employed but not at work in the survey week report no workplace and are left out of the diagram (the table below counts them). For Manhattan residents, working in Manhattan is their own borough and is drawn to Manhattan.
The numbers behind this chart
| Borough of residence | Work from home | Manhattan | Their own borough | Another borough | Outside the city | No workplace reported |
|---|---|---|---|---|---|---|
| Manhattan | 164,400 ± 9,200 | 639,700 ± 15,000 | – | 72,600 ± 6,500 | 36,200 ± 4,600 | 14,900 |
| Brooklyn | 174,900 ± 7,600 | 423,700 ± 10,800 | 533,000 ± 14,100 | 73,100 ± 6,400 | 41,700 ± 5,100 | 30,700 |
| Queens | 114,300 ± 6,800 | 346,900 ± 11,900 | 424,700 ± 12,200 | 122,200 ± 8,200 | 105,600 ± 6,500 | 24,200 |
| The Bronx | 37,600 ± 3,800 | 180,400 ± 9,400 | 245,200 ± 9,600 | 45,000 ± 4,800 | 48,400 ± 5,500 | 17,600 |
| Staten Island | 17,500 ± 2,700 | 45,600 ± 4,600 | 107,500 ± 7,500 | 42,500 ± 4,100 | 17,800 ± 3,300 | 5,900 |
Microdata estimate Tabulated directly from survey microdata, with no model in between: every variable in the chart is observed in the same record, so the relationship shown is measured rather than modelled. It is still an estimate from a sample, not a count of everyone, and the ticks are 90% margins from the survey’s replicate weights.
How to read this, and what it cannot show
One group of bars per borough, five census years, 90% margins from 2010 (none calculated for the 1990 and 2000 samples). Median earnings in 2024 dollars; works in Manhattan among workers who do not usually work from home and report a workplace; works from home among workers at work in the survey week.
The occupation groups year by year, with their margins
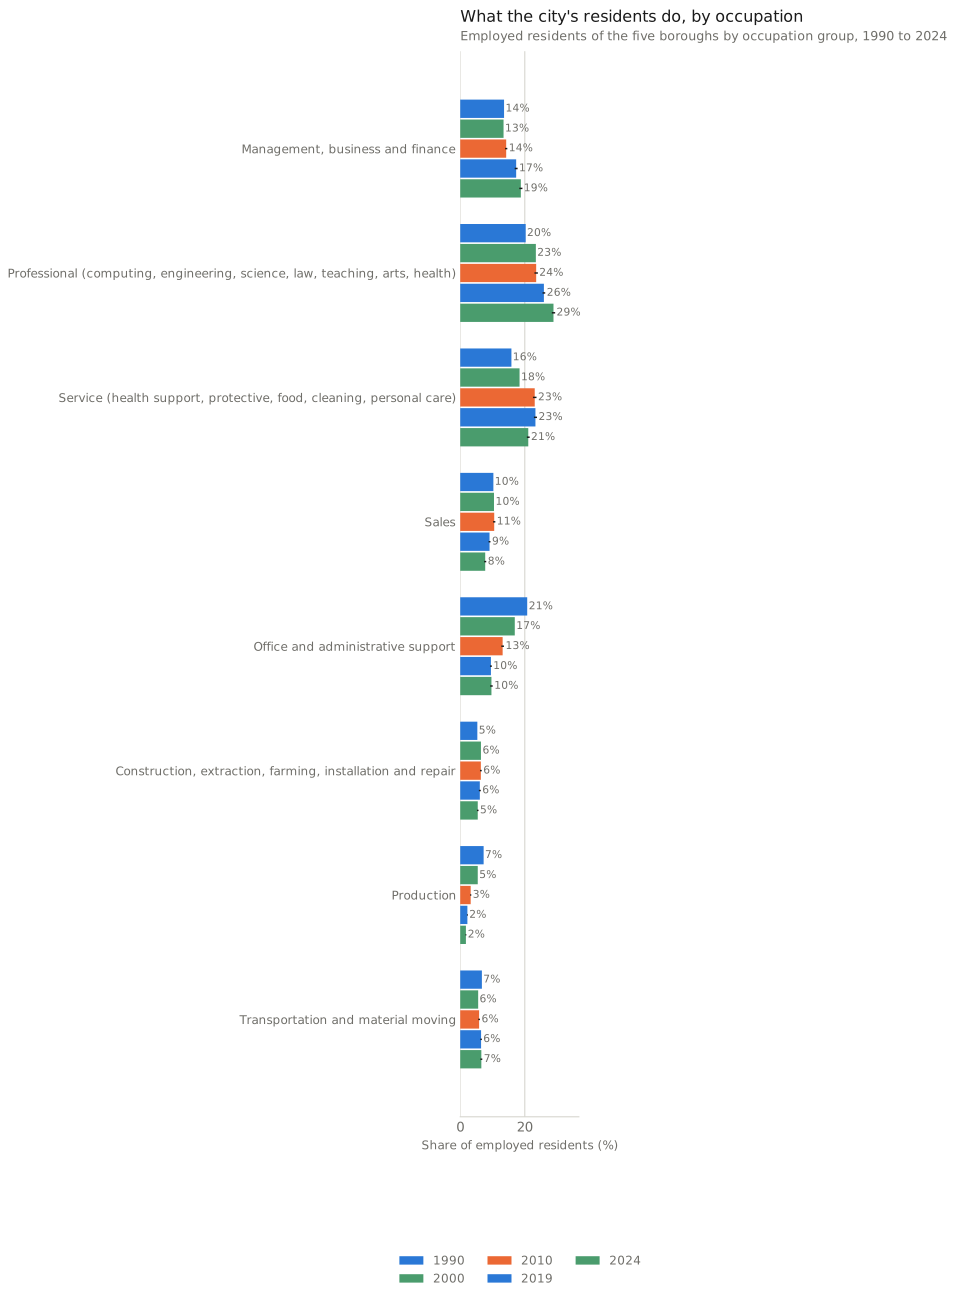
The waffle rounds each group to whole squares. The chart below gives the shares and counts behind it for all five census years, with 90% margins from 2010, and a borough filter.
Microdata estimate Tabulated directly from survey microdata, with no model in between: every variable in the chart is observed in the same record, so the relationship shown is measured rather than modelled. It is still an estimate from a sample, not a count of everyone, and the ticks are 90% margins from the survey’s replicate weights.
How to read this, and what it cannot show
One group of bars per occupation group, five census years, 90% margins from 2010. Eight groups harmonised across the 1990 and 2000-onward coding schemes; the methods note gives the mapping.
Who works for whom: government, private employers and the self-employed
In 2024, 77% of employed residents worked for a private employer, for-profit or non-profit, 13% for federal, state or local government and 10% for themselves. In 1990 the government share was 18% and the self-employed 9%, so the public share of the resident workforce has fallen by a quarter while the payroll count’s government sector grew. The two are not the same measure, which is the seam described above: public-school and public-hospital workers are government employees on the payroll side but appear under education or health when the census classifies their industry. Self-employment is concentrated in transportation and warehousing (22% of workers, the for-hire drivers), other services (17%), professional services (15%) and construction (14%). The monthly survey for January to August 2026 puts the private share at 82%, government at 11% and the self-employed at 7% among the employed at work, a smaller self-employed share than the census’s because the survey classifies incorporated owners as employees of their own company.
Which sectors recovered from the pandemic, and which did not?
By August 2026 the city had 3.5% more payroll jobs than in February 2020 and 4.7% more than in August 2019, the comparable month. Against August 2019, health care and social assistance had 214,000 more jobs, 27% more; government 83,000 more, 14%; financial activities 32,000 more, 6%; professional and business services 19,000 more, 2%. Retail had 50,000 fewer, 14% less; leisure and hospitality 26,000 fewer, 6% less; information 8,000 fewer, 4% less; construction 24,000 fewer, 15% less; manufacturing 17,000 fewer, a quarter. Wholesale and other services were also below 2019. Health care and government together added more jobs than the whole city’s net gain, which is what “dominated” means here: without them, the city would have fewer jobs than in 2019. Every one of those is a count of jobs at the employer’s location, so an office that went hybrid but kept its staff shows no change, and a shop that closed shows the whole loss. The Bureau’s next release for metropolitan areas is scheduled for 30 September 2026, and the July record and preliminary August figure will be revised then.
What does the monthly survey add for 2025 and 2026?
Three things, at a coarser grain. First, the industry mix of employed residents: pooling January to August 2026, 27% in education and health, 18% in professional and business services, 10% in financial activities, 10% in wholesale and retail trade, 9% in leisure and hospitality, 7% in transportation and utilities, 5% in construction, 4% each in information, other services and public administration, 2% in manufacturing, each within a point or two of the same period a year earlier and of the 2024 census once its finer groups are combined. Second, occupations: 28% professional, 22% service, 17% management, business and finance, 9% each sales and office work. Third, the things the census asks only once a year: 25% of employed residents teleworked in the survey week in 2026, against 24% in 2025 and 25% in the second half of 2024, and 83% worked full time. The survey’s sample is about 650 to 750 employed residents a month and adjacent months share most of their people, so these are levels, with month-to-month variation of a point or two, not trends; the survey’s formal sampling error for a sample this size is larger than that variation suggests.
How were the 1990 codes matched to today’s?
The 1990 census coded industries in a scheme of its own and occupations in another, both replaced in 2000 by codes that map to the NAICS industry classification and the Standard Occupational Classification, themselves revised in 2018. The fourteen industry groups used here are the NAICS sectors that the published 2024 table also uses, with two pairs combined (finance with real estate, arts and recreation with accommodation and food); every 1990 code range is assigned to one of them. The Bureau’s Technical Paper 65, which relates the two schemes code by code, warns that many detailed 1990 categories and some major groups have no exact counterpart in the 2000 scheme, so this is a harmonisation of broad groups, not a backcast of today’s classification. Two particularly important seams remain: newspapers, books and other publishing were manufacturing in 1990 and are information from 2000, so 1990 manufacturing is a little larger and 1990 information a little smaller than the later definition would give (1990 information, 1.8% of workers, is the communications industries alone); and the 1990 headings for social services (child care, residential care, job training) are folded into health care and social assistance here, as NAICS folds them. Business and repair services are split: advertising, personnel supply, computing and other business services go to professional services, and automotive and other repair to other services. The eight occupation groups follow the 2000-onward major groups, with the 1990 “technicians” (health technologists, engineering technicians) placed with professionals and the 1990 “handlers, helpers and labourers” with transportation and material moving, as their successors are. The 2000 census stored its occupation codes as three digits, ten times smaller than the four-digit ACS codes, and is scaled before mapping.
How much the mapping matters. The 2024 reproduction checks the modern side of the comparison, not the 1990 side, so the ambiguous 1990 codes were also mapped the other reasonable way and the 1990 shares recomputed: newspapers and other printing and publishing (1990 codes 171 and 172) to information, as the 2000 scheme moved publishing; the 1990 social-service headings kept with other services instead of joining health care; technicians with office and administrative support, as the 1990 census’s own major group had them; and handlers, helpers and labourers with production, as the 1990 “operators, fabricators and labourers” group had them. Everything else is unaffected. The 1990 shares that move, and the thirty-year change under each mapping:
| Group, share of employed residents | 1990, mapping used | 1990, alternative | 2024 | Change, used | Change, alternative |
|---|---|---|---|---|---|
| Manufacturing | 11.5% | 8.8% | 2.7% | −8.8 pts | −6.0 pts |
| Information | 1.8% | 4.5% | 3.9% | +2.1 pts | −0.6 pts |
| Health care and social assistance | 13.4% | 10.7% | 18.3% | +4.9 pts | +7.5 pts |
| Other services | 4.7% | 7.4% | 5.1% | +0.4 pts | −2.2 pts |
| Professional occupations | 20.3% | 17.1% | 28.9% | +8.6 pts | +11.8 pts |
| Office and administrative support | 20.8% | 23.9% | 9.7% | −11.1 pts | −14.2 pts |
| Production | 7.2% | 10.3% | 1.8% | −5.5 pts | −8.5 pts |
| Transportation and material moving | 6.7% | 3.7% | 6.5% | −0.2 pts | +2.8 pts |
The story survives either way. Manufacturing falls by six to nine points, office work by eleven to fourteen, and professional work rises by nine to twelve; health care’s rise is five points on the mapping used and larger on the alternative. What the alternative changes is the small groups: information’s rise and transportation’s flat line both depend on where printing and the 1990 labourers are put, so neither is claimed in the text. The full table is in the results file.
Where this data goes quiet
Detailed occupations across the decades, for the reasons above. Hourly pay, and the pay of the same job over time. The same people over time: every census is a new sample. Second jobs, which the census places at the main one. Commuters from beyond the metro study area, who are in no file here, and the employer of anyone who works from home. The unincorporated self-employed and gig workers, whom the payroll count leaves out. Pay in 2025 and 2026, which the household survey does not ask in its basic questionnaire. Why any sector grew or shrank. The census’s 2025 file, which is not yet published.
Under the hood: data, definitions, estimators and the full results
This is the methods note for everything above. It is deliberately more technical than the rest.
The published anchors. Census tables C24030 (sex by industry) and C24010 (sex by occupation) for the civilian employed population 16 and over of New York city from the 2024 one-year survey, with B23025 for the employment totals, retrieved through the Census Reporter mirror. Sexes are summed and margins combined in quadrature. Fourteen industry rows and eight occupation groups are reproduced; the occupation groups are the table’s own major groups with its management-business-science-arts group split into management, business and finance (one row) and professional (its computer, engineering and science, education, legal, community service, arts and media, and health practitioner rows), and its production-transportation group split into its production and its transportation and material-moving rows.
Residents. 1990: the 5% public-use microdata sample A for New York, persons in the five boroughs identified by the sample’s PUMA prefixes, 125,109 employed records weighting to 3,246,874. 2000: the 5% sample, 131,986 employed records weighting to 3,281,629. 2010: the one-year ACS, 29,424 employed records with 80 replicate weights. 2015, 2019 and 2024: the one-year ACS files for the metro study area, cut to the five boroughs (33,675, 35,044 and 32,948 employed records), with replicate weights. Employed means employment status 1 or 2 (civilian, at work or with a job) and age 16 or over.
Industry. From 2000 the census industry code is NAICS-based and its first two characters give the sector: 11 and 21 agriculture and mining; 23 construction; 31 to 33 manufacturing; 42 wholesale; 44 and 45 retail; 48, 49 and 22 transportation, warehousing and utilities; 51 information; 52 and 53 finance, insurance and real estate; 54 to 56 professional, scientific, management and administrative services; 61 education; 62 health care and social assistance; 71 and 72 arts, entertainment, recreation, accommodation and food; 81 other services; 92 public administration, with the 928110 military codes excluded. The 1990 industry codes map by range: 010 to 050 agriculture and mining; 060 construction; 100 to 392 manufacturing; 400 to 432 and 450 to 472 transportation and utilities; 440 to 442 information (communications); 500 to 571 wholesale; 580 to 691 retail except 641 (eating and drinking places) to accommodation and food; 700 to 712, 742 (automotive rental and leasing) and 801 (video rental) finance, insurance and real estate, since NAICS places rental and leasing with real estate; 721 to 741, 841 and 882 to 893 professional services; 750 to 761, 771 to 791, 873, 880 and 881 other services; 762 (hotels) and 770 (other lodging) accommodation and food; 800, 802 to 810 and 872 arts and recreation; 812 to 840 and 861 to 871 health and social assistance; 842 to 860 education; 900 to 932 public administration; 940 to 960 military. No employed record in any year is left without a group.
Occupation. From 2000 the codes map by range: 10 to 950 management, business and finance; 1000 to 3599 professional; 3600 to 4699 service; 4700 to 4999 sales; 5000 to 5999 office and administrative support; 6000 to 7699 construction, extraction, farming, installation and repair; 7700 to 8999 production; 9000 to 9799 transportation and material moving; 9800 and above military. The 2000 census codes are three-digit and are multiplied by ten. The 1990 codes: 003 to 037 management; 043 to 235 professional (including technicians); 243 to 285 sales; 303 to 389 office; 403 to 469 service; 473 to 617 farming, mechanics, construction and extraction; 628 to 799 production; 803 to 889 transportation, material moving, handlers and labourers; 903 to 905 military.
Other variables. Class of worker: private (codes 1 and 2), government (3 to 5), self-employed (6 and 7); the 1990 and 2000 files use the same codes. Place of work: workplace state 36 and a place-of-work area among the five boroughs’ codes for the file’s vintage (1990: 5000 Bronx, 5100 Manhattan, 5200 Staten Island, 5300 Brooklyn, 5400 Queens, inferred as the modal code of each borough’s residents working in-state; 2000 and 2010: 3700 to 4100; 2020 geography from 2022: 4100 to 4500); works from home is means of transportation 11 (12 in the 1990 and 2000 codes, recoded). The census asks the journey-to-work questions only of workers at work in the survey week, so working from home is measured among them, the universe of the Bureau’s commuting tables (about 98% of employed residents); every workplace measure is computed among workers who do not usually work from home, since the census records a home worker’s workplace as their home. Degree: bachelor’s or higher among workers 25 and over. In the 1990 file the attainment item YEARSCH runs 00 to 17 and its dictionary (PUMSUSDD, from the Bureau’s 1990 PUMS documentation) codes 10 as a high-school diploma, 11 as some college without a degree, 12 and 13 as associate degrees, 14 as a bachelor’s degree, 15 a master’s, 16 a professional degree and 17 a doctorate, so a degree is code 14 or higher; 2000: education code 13 or higher; ACS: 21 or higher. The extraction script that applies these codes is published beside the analysis script. Foreign-born: nativity 2 in the ACS, citizenship 4 or 5 in 2000, citizenship 3 or 4 in 1990. Sex is coded 0 and 1 in the 1990 file and 1 and 2 elsewhere.
Hours, weeks and earnings. Earnings are own wage, salary and self-employment earnings in the income year. The 2015 to 2024 extracts already carry the Bureau’s within-year factor and the New York-metro CPI to 2024 dollars and are used as they stand; the 2010 extract is multiplied by its within-year factor (ADJINC, about 1%) and then, like the 1990 and 2000 extracts, deflated with the annual New York-metro CPI of the income year (1989 for the 1990 census, 1999 for the 2000 census, 2010 for the 2010 file). The sensitivity check in the first question converts the 1990 medians back to 1989 dollars with the metro index and forward with the R-CPI-U-RS annual averages (188.3 for 1989, 462.5 for 2024). Hours are usual weekly hours in the income year: HOUR89 in 1990 (the 1990 file’s other hours item counts the census week and is not used), HOURS in 2000, WKHP in the ACS. Full year is 50 to 52 weeks worked in the income year: WEEK89 in 1990, WEEKS in 2000, WKW code 1 in the 2010 and 2015 files and WKWN of 50 or more from 2019. Full time is usual hours of 35 or more. Medians are weighted medians among workers with positive earnings; earnings in the old censuses were reported in round amounts, so several 1990 group medians share a value. Their margins, shown only for the 2010-onward files, are Woodruff-style approximations: the replicate-weight standard error of the share of the group below the median, turned into a dollar interval on the group’s earnings distribution read on $2,500 intervals with linear interpolation. This is not the Bureau’s design-factor recipe for microdata medians; recomputing the median itself with each replicate weight gives near-zero margins here, because the heaped earnings put the median on the same round amount in every replicate.
Jobs in the city. From the 2015, 2019 and 2024 study-area files, every employed worker who does not usually work from home and whose workplace is in the five boroughs, resident or not: 4,437,797 in 2015, 4,569,312 in 2019 and 4,209,283 in 2024, with commuter shares of 20.2%, 21.8% and 21.6%. Home workers are excluded because the census records their place of work as their home address, so a resident working from home for a Connecticut firm would otherwise count as a city job and a New Jersey resident working from home for a Manhattan firm would not. The study area is the five boroughs, Long Island, the Lower Hudson Valley, northern New Jersey and southwestern Connecticut; commuters from beyond it are not in the files.
Neighbourhoods and flows. The map covers the 55 public-use microdata areas of the five boroughs (2020 definitions), each holding a few hundred employed records, with shapes from the Census Bureau’s 2020 cartographic boundary file, simplified for the page. The flow diagram assigns each employed resident of a borough to working from home, their own borough, Manhattan (for residents of the other boroughs), another borough or a workplace outside the city; residents employed but not at work in the survey week report no workplace and are counted separately.
Payroll jobs. Current Employment Statistics, state and area, area 93561 (New York city), all employees, not seasonally adjusted: total nonfarm, total private and thirteen supersectors and components, January 1990 to August 2026, fetched from the public API in four ten-year requests and cached with provenance. The series is a sample survey of employers, benchmarked each year to unemployment-insurance records; the Bureau publishes its sampling error separately and none is drawn here, and the latest month is preliminary. Annual figures are means of the published months; 2026 is the January-to-August mean. Same-month comparisons use August; the record is the highest single month in the series. The timeline’s twelve-month average is the mean of each month and the eleven before it.
The monthly survey. Current Population Survey basic monthly files, June 2024 to August 2026 (no October 2025 file), employed-at-work residents of the five counties 16 and over, weighted by the final person weight, with the major industry recode (which combines wholesale with retail and education with health), the major occupation recode and class of worker (1 to 3 government, 4 private, 5 and 6 self-employed). Periods are pooled. The ticks are 1.645 times the standard deviation of the monthly estimates within the period, divided by the root of the number of months: a description of month-to-month variation, not a survey margin, and it understates the true error because adjacent months share about three quarters of their sample.
Estimators. For files with replicate weights, any statistic computed with the full weight is recomputed with each of the 80 replicate weights and the variance is the Bureau’s successive-difference estimator, four-eightieths of the summed squared deviations; margins are 90%, or 1.645 standard errors. The 1990 and 2000 samples carry no replicate weights and are reported without a margin. A published row is reproduced if the difference is within the root of the summed squared margins. Chart cells resting on fewer than 30 records are labelled too thin rather than drawn.
The full 2024 results. Employed residents 4,153,819 ± 24,000. By industry: health care and social assistance 18.3%, professional, management and administrative services 16.8%, education 9.9%, arts, entertainment, accommodation and food 9.4%, finance, insurance and real estate 8.8%, retail 8.2%, transportation, warehousing and utilities 6.6%, other services 5.1%, construction 4.8%, information 3.9%, public administration 3.7%, manufacturing 2.7%, wholesale 1.6%, agriculture and mining 0.1%. By occupation: professional 28.9%, service 21.1%, management, business and finance 18.8%, office and administrative support 9.7%, sales 7.7%, transportation and material moving 6.5%, construction, extraction, farming, installation and repair 5.4%, production 1.8%. Private employer 76.5%, government 13.2%, self-employed 10.2%. Women 49.8%, foreign-born 43.3%, degree (25 and over) 52.2%, aged 55 and over 22.6%, usual hours 35 or more 79.2%; works from home 12.5% of the 4,060,522 workers at work; among residents who do not work from home and report a workplace, 93.0% work in the five boroughs and 46.1% in Manhattan; median annual earnings $54,824 ± $822, full-time $69,037 ± $1,372, full-time full-year $71,068 ± $550 (72.1% of workers with earnings). The 1990 equivalents: employed 3,246,874; manufacturing 11.5%, finance 12.6%, health 13.4%, professional services 10.9%; office and administrative 20.8%, professional 20.3%, service 15.9%, management 13.6%; government 18.0%, self-employed 8.6%; women 47.6%, foreign-born 34.1%, degree 31.9%, 55 and over 15.1%, usual hours 35 or more 80.9%; works in Manhattan 47.5% of those travelling to a workplace, from home 0.5% of workers at work; median annual earnings $56,317, full-time $62,778, full-time full-year $69,116 (64.0% of workers with earnings), in 2024 dollars on the metro index ($54,038, $60,237 and $66,319 on the R-CPI-U-RS). Jobs in the city, 2024, held by people who travel to them: 4,209,283, of which 21.6% held by commuters; commuter shares by industry from 33.3% in finance, insurance and real estate and 30.3% in public administration to 13.1% in the arts, accommodation and food; median annual earnings $96,449 for commuters and $52,793 for residents at city workplaces; 508,704 residents usually work from home. Payroll jobs, August 2026: 4,850,000 total; health care and social assistance 1,011,700, professional and business services 796,500, government 679,000, financial activities 525,900, leisure and hospitality 443,200, retail 295,500, educational services 232,600, information 217,200, other services 179,000, transportation, warehousing and utilities 144,500, mining, logging and construction 139,500, wholesale 134,900, manufacturing 50,500.
Rerunning it. The analysis script computes every figure and number above, the bar charts and the dashboard in one run from a fixed seed; its docstring is the long-form method. The extraction script that reads the 1990 and 2000 5% samples and the 2010 file and applies the industry, occupation, degree, hours and weeks definitions is published with it; the payroll series, the monthly survey and the template charts (src/article_jobs_viz.py) are separate scripts named in the docstring. The companion dataset is the census records themselves: every employed resident in the 2010 and 2024 files and every worker with a city workplace in the 2024 study-area file, with their survey weights, usual hours, full-year and at-work flags and the derived variables, so a weighted count of residents within a year reproduces the headline counts; the 257,000 employed residents of the 1990 and 2000 5% samples are in a second, compressed file with the same columns. The build manifest names the version of this page the run was made for and the checksum of the script and of every file linked here.
Sources
- U.S. Bureau of Labor Statistics — Current Employment Statistics, New York city, all employees by supersector, not seasonally adjusted (Monthly series January 1990 to August 2026, retrieved from the public API on 26 September 2026; the next metropolitan-area release is scheduled for 30 September 2026) — 4,896,600 jobs on payrolls in July 2026 and 4,850,000 (preliminary) in August; 4,685,500 in February 2020 and 3,759,200 in April 2020; health care and social assistance 1,011,700, government 679,000, professional and business services 796,500, financial activities 525,900, manufacturing 50,500 in August 2026
- U.S. Census Bureau — Sex by Industry (C24030) and Sex by Occupation (C24010) for the civilian employed population 16 years and over, and Employment Status (B23025), New York city, ACS 2024 1-year (ACS 2024 1-year tables, released 11 September 2025; the 1-year PUMS followed on 4 December 2025) — 4,155,558 employed residents; 758,008 in health care and social assistance, 697,660 in professional, scientific, management and administrative services, 365,935 in finance, insurance and real estate; every industry and occupation row reproduced from the microdata
- U.S. Census Bureau — ACS 2010 and 2015–2024 1-Year PUMS, New York, New Jersey and Connecticut state files (the metro study area), with replicate weights (ACS 2010 and 2015–2024 1-year releases) — every count, share and margin labelled census for 2010 and later; residents from the New York file, jobs located in the city from all three files (workers with a workplace in the five boroughs); 2010 from the New York file only
- U.S. Census Bureau — Census 2000 5-Percent Public Use Microdata Sample, New York (2000 census, 5% sample) — 131,986 employed residents of the five boroughs in the sample, weighted to 3,281,629; industry and occupation by the 2000 census codes, income, hours and weeks for 1999
- U.S. Census Bureau — 1990 Census of Population and Housing, Public Use Microdata Sample A (5%), New York (1990 census, 5% sample) — 125,109 employed residents of the five boroughs in the sample, weighted to 3,246,874; industry and occupation by the 1990 census codes, income, usual hours and weeks worked for 1989
- U.S. Census Bureau and Bureau of Labor Statistics — Current Population Survey basic monthly public-use files, June 2024 to August 2026 (monthly files to August 2026; no October 2025 file) — employed-at-work residents of the five boroughs with the survey's major industry and occupation recodes; about 650 to 750 a month
- U.S. Bureau of Labor Statistics — Consumer Price Index, New York-Newark-Jersey City, all items (Annual averages 1989 to 2025 and January–August 2026, retrieved from the public API) — the deflator that puts 1989, 1999 and 2010 earnings in 2024 dollars
- U.S. Bureau of Labor Statistics — R-CPI-U-RS, the consumer price research series using current methods, U.S. city average, all items (Annual averages 1978 to 2025, file retrieved 26 September 2026) — the national series the Census Bureau uses for constant-dollar comparisons; used here as a sensitivity check on the 1990-to-2024 earnings change (1989 average 188.3, 2024 average 462.5)
- U.S. Census Bureau — Technical Paper 65, The Relationship Between the 1990 Census and Census 2000 Industry and Occupation Classification Systems (Scopp, 2003) (October 2003; the paper and its industry crosswalk table retrieved 26 September 2026) — the code-by-code relationship between the 1990 and 2000 industry and occupation schemes behind the thirty-year harmonisation, and its warning that many detailed categories are not directly comparable
- U.S. Census Bureau — Cartographic Boundary File, 2020 Public Use Microdata Areas, New York, 1:500,000 (GENZ2020 release; the 2020 PUMA definitions used by the ACS from the 2022 files) — the neighbourhood shapes in the map, clipped to the shoreline
Cite this article
Reference
BibTeX
Quote the version: a correction bumps it, and the corrections log says what changed. Charts can be embedded from the “Embed this chart” link under each one.