
Ask a New York parent what it takes to raise a child here and the answer is a list: the apartment with a second bedroom, the daycare waitlist, the nanny share, the 3-K lottery, the grandparent in Queens, and the friends who moved to Montclair. The published numbers behind that list are mostly totals. The Census Bureau’s 2024 table on children and their parents’ jobs says the city has 516,012 children under six living with a parent, and that 211,677 of them live with two parents who are both in the labor force. It cannot say how that changes as a child grows, where those families live, what they earn, whether the three-year-olds are in a preschool, who the nannies are, or how many of the families leave.
The census microdata behind that table can, because each child’s record carries the parents’ employment status alongside the household’s income, rent, borough and the enrolment of every child from age three, and each adult’s record carries an occupation, an industry, hours and earnings. So let’s read it, for 2015, 2019 and 2024, add the State’s child-care rate schedule for what care costs, the national census file for the families that left, and the Bureau’s population estimates for the year past the survey. Every chart is interactive, and the records and code sit at the end.
Half a million children under six, and fewer every year
Start with how many there are. In 2024 about 543,000 residents of the five boroughs were under six, counting the children living with grandparents and the few in group quarters that the published table leaves out, and about 264,000 were under three.
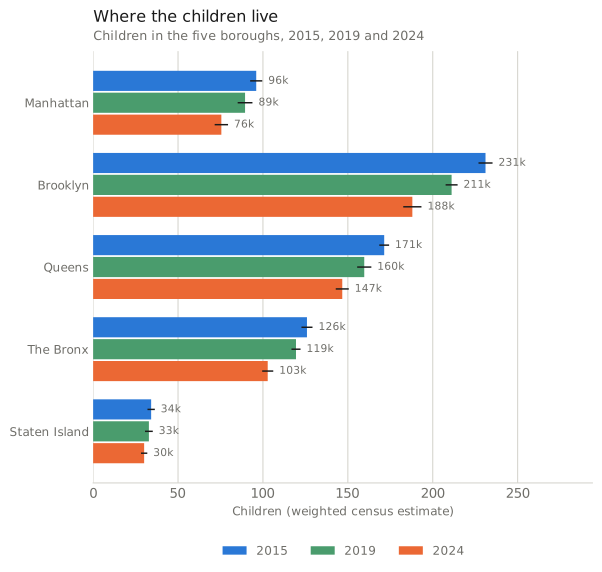
That is a much smaller number than the city had a decade ago. In 2015 the count was 659,000, so the city has about 116,000 fewer small children than it did then, a fall of a sixth, in a decade when the population as a whole barely moved. Brooklyn has the most of them, Manhattan the fewest.
Measured Tabulated from survey microdata. Every variable in the chart is observed in the same record, so the relationship shown is measured rather than modelled, and the ticks are 90% margins from the survey’s replicate weights.
How to read this, and what it cannot show
One group of bars per borough, 2015, 2019 and 2024, with the 90% margin of error as a black tick. Residents under the age chosen, household and group quarters together. Each year is a separate one-year census sample.
Before going further, a check. The published table’s rows for children under six, each combination of two parents or one and in or out of the labor force, all reproduce from the microdata within the published margin in 2019 and in each year from 2021 to 2024. The full comparison is in the Reproduce box below. From here on every number is one the table does not print.
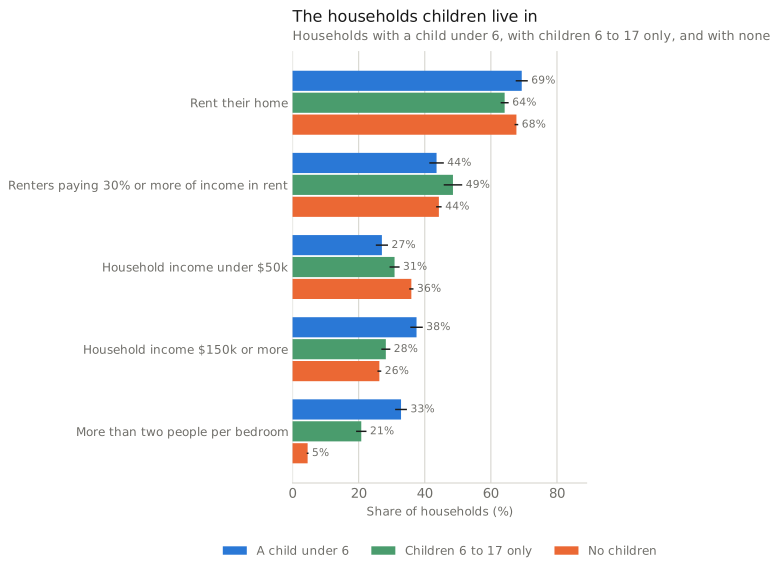
The households those children live in are not the city’s average household. A household with a child under six earned about $103,000 at the median in 2024, against $79,000 for a household with no children.
That gap is wider than it looks, because it is spread across five very different boroughs. The typical Manhattan household with a small child earned about $258,000, and the typical Bronx one about $58,000; the FAQ has the other three.
What the families share is space, or the lack of it. A third of households with a child under six have more than two people per bedroom, against one household in twenty without children. Seven in ten of the children under six live in a rented home, and among the families that rent, 45% pay more than the 30% of income that the usual rule calls affordable.
Measured Tabulated from survey microdata. Every variable in the chart is observed in the same record, so the relationship shown is measured rather than modelled, and the ticks are 90% margins from the survey’s replicate weights.
How to read this, and what it cannot show
Three bars per trait: households with a child under six, with children aged six to seventeen only, and with no children, in the year chosen. Household-weighted, with the housing unit’s own replicate weights. Rent burden is gross rent of 30% or more of income among renters with a computed ratio; crowding is more than two people per bedroom, a studio counted as half a bedroom.
Who stays home, and who is at work
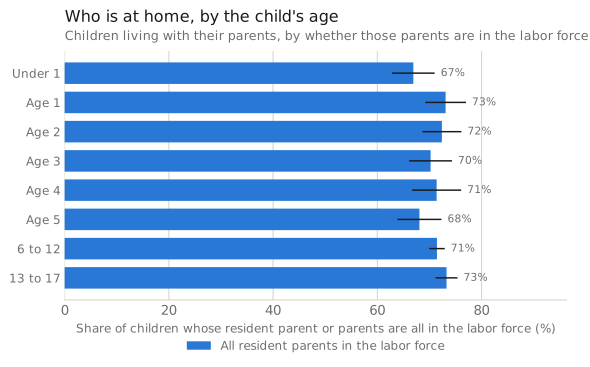
Now to the parents. The published table sorts the children who live with a parent by whether those parents are in the labor force, and the microdata lets the same sorting run by the child’s age, borough and household income. Among children under six living with a parent in 2024, 41% live with two parents who are both in the labor force, and a further three in ten live with one parent who is. Put those together and seven in ten of the children living with a parent have every parent they live with at work or looking for work.
The other 30% live with a Not in the labor force Neither working nor looking for work in the survey week: at home with the children, studying, retired, disabled, or between jobs and not searching. The census records the status and not the reason, so “a parent at home” here means a parent who is not in the labor force, whatever the reason. Someone on paid leave from a job counts as employed. : one in five with two parents of whom one is at home, one in twelve with a lone parent who is. That share was 37% in 2015, so the parent at home has been receding for a decade, and it recedes with the child’s age too, though less than you might expect. A third of infants live with a parent at home; by age one it is about a quarter, and it barely moves after that.
Measured Tabulated from survey microdata. Every variable in the chart is observed in the same record, so the relationship shown is measured rather than modelled, and the ticks are 90% margins from the survey’s replicate weights.
How to read this, and what it cannot show
One bar per age of child, with 90% margins. Each child’s own record says whether they live with two parents or one and whether each is in the labor force; the Own children, and the parents’ employment item The census calls a child an “own child” when they live with at least one parent: as the son or daughter of the householder, or in a subfamily (a parent and child living in someone else’s household, such as a grandparent’s). For each own child under 18 the Bureau records whether the child lives with two parents or one and whether each of those parents is in the labor force. That item is the one behind the published table, and it is carried on the child’s record, not the parent’s.Children living with grandparents or other relatives without a parent present, and children in group quarters, are outside it and are shown separately as “not living with a parent”. is children living with at least one parent. Not living with a parent, the last option, is measured among all household children of that age.
Does salary come into it? Less than the raw numbers suggest. Sort mothers of small children by their household’s income and the parent at home looks like a low-income arrangement: 44% of those in households under $25,000 are out of the labor force, against about one in eight in the top two income bands. But a household’s income contains the mother’s own earnings, so a mother who stops working moves her household down that scale by the act of stopping.
Take her own income out and ask about the rest of the household’s, and the gradient mostly flattens. About a fifth of mothers are out of the labor force when the rest of the household earns under $25,000, about a third when it earns between that and $100,000, and about a fifth again at every band above that, all the way up. The first cut was largely mechanical. The mother outside the labor force is neither a luxury nor a mark of poverty in 2024; she is most common in the middle.
What has changed is the top. Among mothers whose household earns more than $300,000 without her, 43% were out of the labor force in 2015 and about a fifth in 2024, a fall well outside the survey margins on either figure. The affluent mother outside the labor force, the figure the folklore calls the stay-at-home mother, has halved in a decade; the FAQ has the whole gradient for both years, with its margins, and by borough, race and nativity.
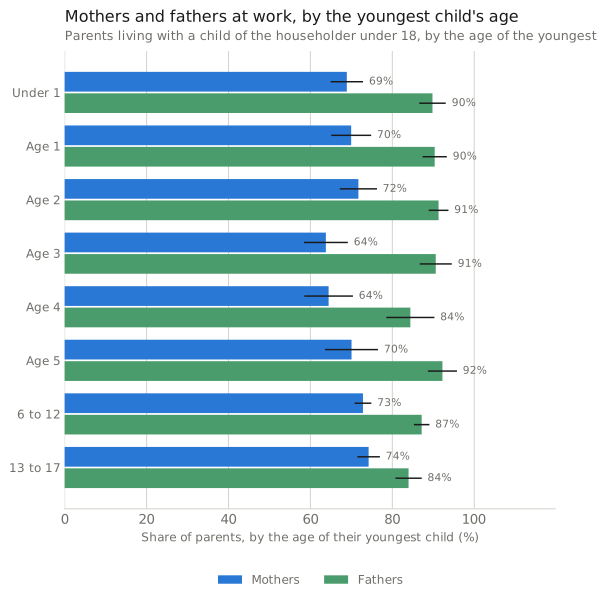
The question every expecting parent asks is when the other parent goes back, and the census can only answer it sideways. It does not follow a mother through her child’s first years; it photographs different mothers whose youngest children are different ages. In that 2024 photograph, mothers whose Parents, by the youngest child’s age A parent here is the householder, or the householder’s spouse or partner, in a household where a child of the householder under 18 lives; the youngest child’s age is the age of the youngest such child. The census does not link a child to a specific parent, so a step-parent or partner counts as a parent of the householder’s children, and a parent living in someone else’s household (a subfamily) is not counted as a parent in this measure, though their child is in the children’s measures. is under one are employed 69% of the time, and someone on paid leave from a job counts as employed; mothers of five-year-olds are employed 70% of the time. The employment rate differs surprisingly little by the age of the youngest child.
Measured Tabulated from survey microdata. Every variable in the chart is observed in the same record, so the relationship shown is measured rather than modelled, and the ticks are 90% margins from the survey’s replicate weights.
How to read this, and what it cannot show
Two bars per age of the youngest child, mothers and fathers, with 90% margins. A parent is the householder, spouse or partner in a household with a child of the householder under eighteen; the census does not link a child to a specific parent. Employed means at work or with a job in the survey week, including paid leave; the labor force adds people looking for work; full time is 35 hours a week or more. Each bar is a different set of parents, not the same parents followed over time.
The better question for the first year is asked of the women who actually had a baby. The census asks every woman of childbearing age whether she gave birth in the past twelve months, and of the roughly ninety thousand who said yes in 2024, 70% were in the labor force and about two thirds were employed, half of them full time. In 2015 the labor force share was 63%. Mothers of new babies are more attached to a job than they were, and the 2015 photograph also showed a gap between mothers of infants and mothers of five-year-olds that the 2024 one does not.
What care costs, and who provides it
Most infants who live with a parent, then, live with parents who are all attached to the labor market. Who is minding them on a weekday is a question the census cannot answer: it asks about school from age three and never about a daycare, a nanny, a grandparent, a night shift or a home office, and a parent counted as employed may be on leave or at home with the child. What it does measure is the incomes of the families and the earnings of the people who do the caring, so let’s bring in the price.
New York State sets, from a survey of what providers charge, the most it will pay for a subsidised child. From October 2024 a day care centre in the five boroughs is paid up to $500 a week for an infant, which is $26,000 a year, the figure the City Comptroller also uses for the cost of centre care. A family day care home is paid a fifth less.
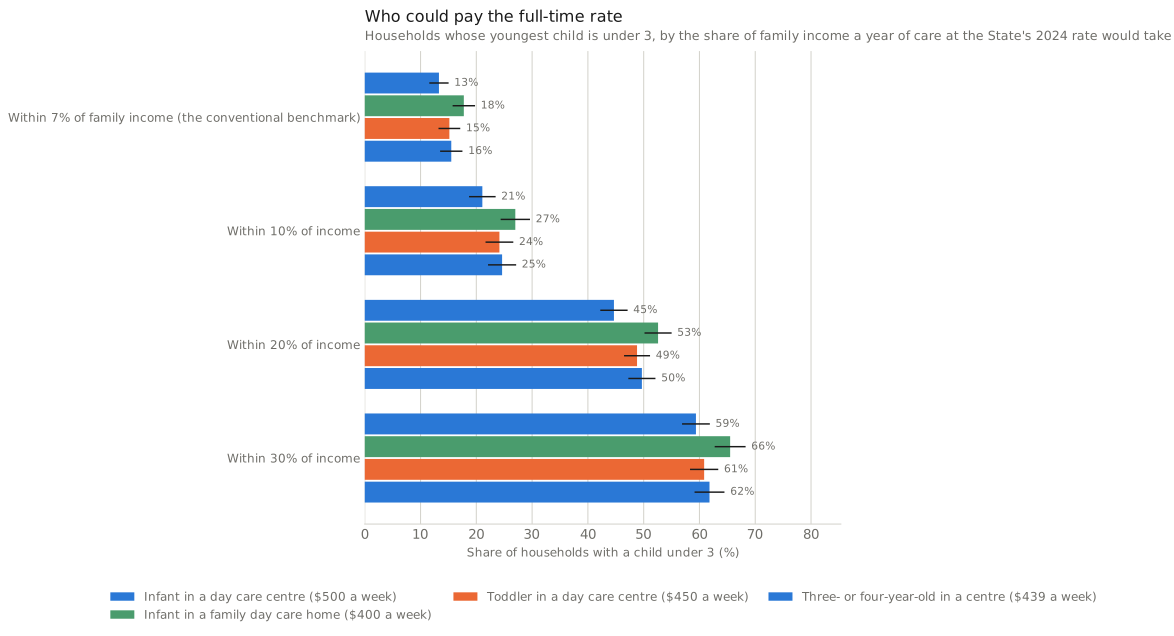
Set those against the incomes of the families whose youngest child is under three, counting the income of the householder and everyone related to them, which is how the census defines a family and how the benchmark is defined; an unmarried partner’s income is not in it, and the FAQ shows that counting the whole household instead barely moves the result. The City Comptroller’s yardstick calls care affordable when it takes 7% of family income or less, a line drawn from a federal subsidy rule that Washington rescinded this July; it is kept here as a reference point so the calculation is comparable with the Comptroller’s, not as a current federal standard. By it, a year of infant care in a centre fits the budget of 13% of those families. Allow a fifth of family income and it fits fewer than half. Manhattan’s families are the exception: nearly half of them could pay the centre rate within the line.
Computed Survey records combined with published parameters, such as a tax schedule or a budget standard. The tick is the survey margin on the computed quantity; the parameters carry their own uncertainty, and the FAQ gives the range under alternative assumptions.
How to read this, and what it cannot show
Households whose youngest child is under three, by whether a year of care at the The State’s child-care rate New York State sets, from a periodic market rate survey, the maximum weekly amount it will pay a provider for a subsidised child, by county group, age of child and type of care. For the five boroughs from 1 October 2024 a day care centre’s rate is $500 a week for an infant, $450 for a toddler and $439 for a three- or four-year-old; a family day care home’s is $400, $350 and $325. The City Comptroller multiplies these by 52 weeks to state an annual cost of care, and so does the calculation here.It is a payment ceiling drawn from what providers charge, not a measurement of what any family pays: families with subsidies, sibling discounts, part-time schedules or a nanny share pay something else. is within the share of their 2024 family income shown; four rates, one per bar colour. The rate is a published parameter times 52 weeks, not what any family pays; the tick is the census margin on the share. The 7% line is the Comptroller’s conventional benchmark, from a federal rule rescinded in July 2026. Families with a subsidy, a sibling discount, a part-time place or a nanny share pay something else.
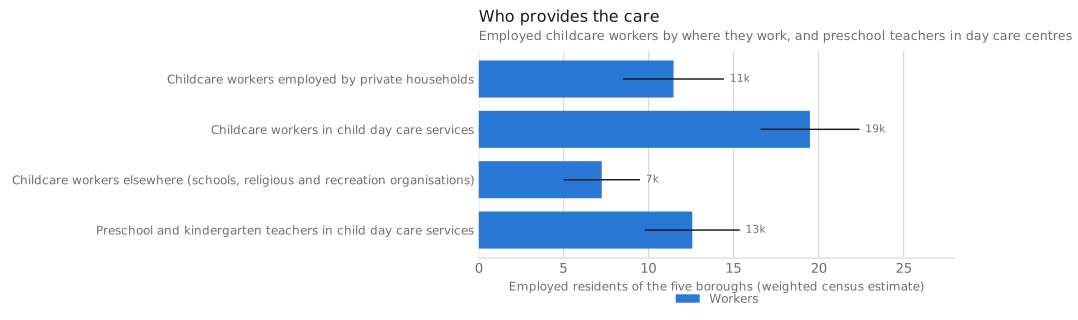
The other side of the price is the people paid it. The census finds about 11,000 residents who work as childcare workers for private households, the nannies and babysitters a family employs directly, and 19,000 in day care centres and licensed homes. That is certainly an undercount of an informal trade, and the FAQ says why, but the people it does find are consistent: almost all women, six in ten born abroad, and a median age in the mid-forties.
Their reported earnings are low. The median nanny reports about $17 an hour and the median centre worker about $14, roughly half of what the city’s median worker reports. One nanny in five, and one centre worker in three, lives below the poverty line.
Measured Tabulated from survey microdata. Every variable in the chart is observed in the same record, so the relationship shown is measured rather than modelled, and the ticks are 90% margins from the survey’s replicate weights.
How to read this, and what it cannot show
One bar per group, employed residents of the five boroughs by their own occupation and industry. Hourly earnings are the year’s earnings divided by usual hours and weeks, for people reporting all three, in 2024 dollars, medians without a margin. Counts carry margins, and the nanny count rests on about 75 records.
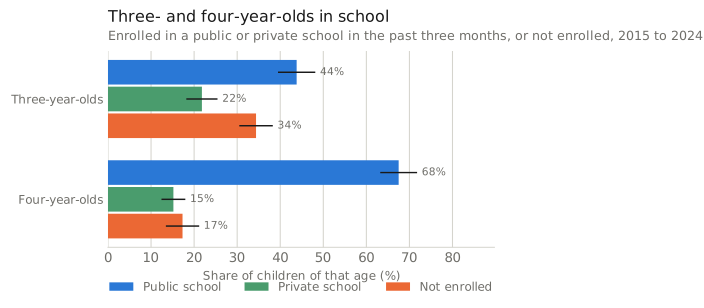
At three the picture changes, because the census starts asking about school and the City has been paying for it. In 2015 fewer than half of the city’s three-year-olds were enrolled anywhere, and a quarter were in a public school. In 2024, after the expansion of 3-K, two thirds were enrolled and 44% were in a public school; the census records enrolment, not the program, so it cannot say which seats belonged to it, only that the public share doubled while private enrolment held. Among four-year-olds the public share rose by about a seventh of the age group while the private share shrank.
Measured Tabulated from survey microdata. Every variable in the chart is observed in the same record, so the relationship shown is measured rather than modelled, and the ticks are 90% margins from the survey’s replicate weights.
How to read this, and what it cannot show
Three bars per age: enrolled in a public school, in a private school, or not enrolled in the past three months, as the household reports it. At three and four that is nursery school, preschool or kindergarten. The 2020 file uses the Bureau’s experimental weights.
At two the City has just started. The first free 2-K classes opened this September in four communities spanning five school districts, with about 2,000 seats after nearly three applications for every one of them, and the City says it will offer several times as many the year after. That is a small fraction of the city’s two-year-olds, and it is after the 2024 survey, so nothing above reflects it; the FAQ has the districts, the dates and the planned numbers.
Who leaves
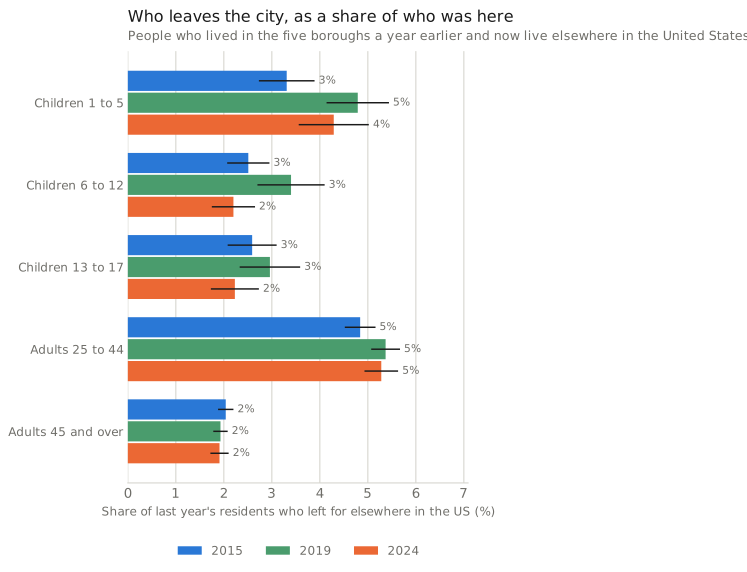
The last question is whether these families stay. The census asks everyone aged one and over where they lived a year earlier, so a child who moved from Brooklyn to Maplewood answers it from New Jersey, and the national file finds them. Read that way, children aged one to five have one of the city’s highest domestic out-migration rates, behind only young adults: 4.3% of those who lived here a year earlier had left for elsewhere in the country by 2024, against about 2% of teenagers and of older adults.
That rate has been higher in every year since 2015, when it was 3.3%, and it peaked in the pandemic. Among adults in their late twenties and thirties, those who now live with children left less often in 2024 than those who now do not; since the census records a household after any move, that compares the households people ended up in, not the families they were before leaving, and the FAQ gives the figures with that caveat.
Measured Tabulated from survey microdata. Every variable in the chart is observed in the same record, so the relationship shown is measured rather than modelled, and the ticks are 90% margins from the survey’s replicate weights.
How to read this, and what it cannot show
The The out-migration rate Leavers divided by everyone who lived in the city a year ago and is still in a US census file: the people who stayed, the people who moved within the city and the leavers. It leaves out people who died or moved abroad during the year, so it is the share of last year’s residents who are now somewhere else in the country. Group characteristics (age, income, tenure) are as measured now, after any move. : people who lived in the city a year ago and now live elsewhere in the United States, as a share of everyone who lived here a year ago and is still in a US census file, 2015, 2019 and 2024. Infants are not in it, since the question is asked from age one. The income view classifies a child by the household they live in now, after the move, and rests on few records.
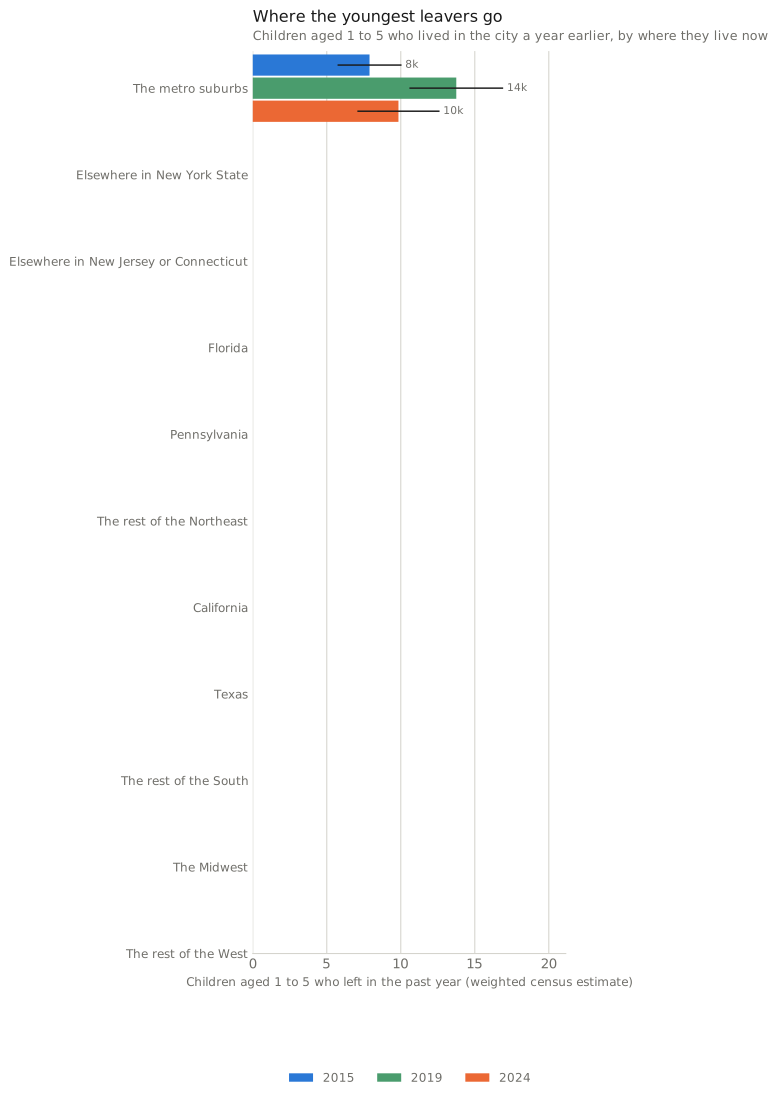
Where the small children go is the shortest move. 50% of the one-to-five-year-olds who left in 2024 went to the metro suburbs, Long Island, the Lower Hudson Valley and northern New Jersey in near-equal shares, and Florida took about one in twenty. The households they now live in are owner-occupied 52% of the time, against 31% for the small children who stayed, and earn more at the median.
Those are facts about where the families ended up, not about what they had before. A child’s household income in the census is the income of the household they live in now, so the leaving families cannot be ranked by what they earned in New York; the migration piece explains the limit. What the exchange with the rest of the country does say is that the city sends out more small children than it takes in: a net loss of about 13,000 one-to-five-year-olds in 2024, partly offset by about 8,000 who arrived from abroad.
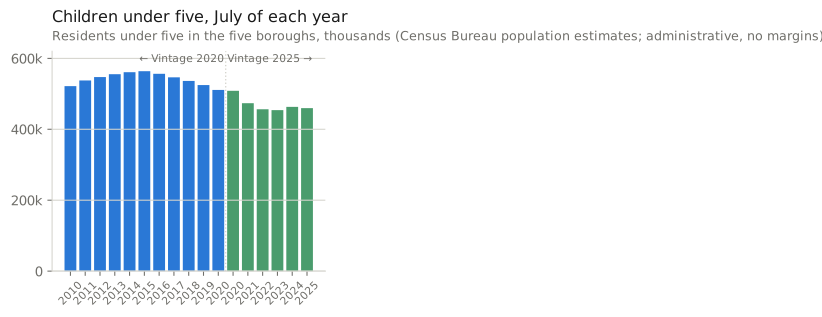
The census microdata stops at the 2024 survey. For 2025 we switch to the Census Bureau’s own count of under-fives, which has no sampling margin and runs to July 2025.
The Bureau estimates the population by age every year from births, deaths and migration records, and its under-five series says what the survey says, a year later and without a margin. It comes in two vintages built on different censuses, and the Bureau’s advice is to compare years within a vintage only. Within the older one, the city’s under-five population fell by about a tenth between July 2015 and July 2020; within the newer one it fell by about a tenth again between July 2020 and July 2025, to 460,000, and has been flat since 2022. Manhattan’s fell fastest in both.
Administrative Counts from an agency’s own records, such as turnstiles and toll plazas. They carry no sampling margin, but they count trips or transactions rather than people, and they cannot be cut by who the traveller is.
How to read this, and what it cannot show
One bar per July, for the five counties or one borough. The years to 2020 come from the Bureau’s Vintage 2020 series, built on the 2010 census, and 2020 onward from Vintage 2025, built on the 2020 census; the two do not splice, which is why July 2020 appears twice, and no change is computed across the line. Administrative estimates, no margins.
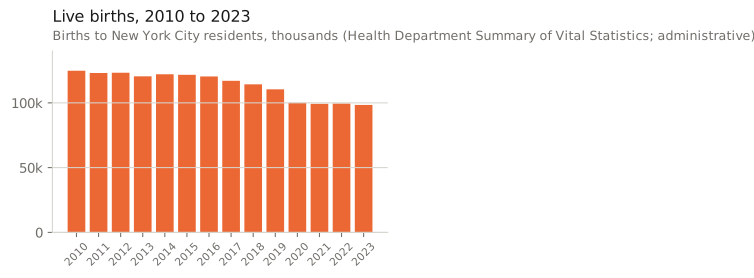
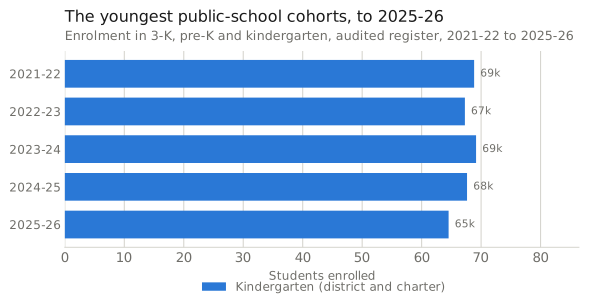
Two City series run later still and point the same way. Births to city residents fell by a fifth between 2015 and 2023, to 98,389, and the kindergarten cohort of 2025-26 was the smallest on the school register. The FAQ carries both charts and what the register says about the preschool seats.
So how are parents navigating the city?
By staying attached to the labor market, mostly both parents, from the first year. The New York child under six who lives with a parent has every resident parent working or looking for work seven times in ten, up from six in ten a decade ago, and among affluent mothers, being outside the labor force has become much less common: once her own earnings are set aside, a mother is no more likely to be out of the labor force at the top of the income scale than at the bottom, and half as likely at the top as in 2015. Mothers of new babies are more often in a job than they were. Who minds the children while they work is the one thing this data cannot say.
It can say what care costs and who is paid for it. A year of infant care at the rate the State itself pays is within the conventional 7% line for one family in eight, and within a fifth of family income for fewer than half; the nannies and day care workers who provide it report earnings near the bottom of the city’s scale, and many are poor. At three, public provision becomes substantial: as 3-K expanded, public enrolment of three-year-olds nearly doubled while private enrolment held, though a third of three-year-olds are still enrolled nowhere. At two it has just begun, for a few thousand children.
And the count of small children is falling. Births are down a fifth since 2015; children aged one to five leave for elsewhere in the country at a higher rate than anyone but young adults, half of them for the suburbs; the under-five population fell by about a tenth in each of the two estimate series; and the households raising the children who remain are fewer, higher-earning at the median and more crowded than households without children, with Manhattan’s families now a small and unusually wealthy group. What the data cannot say is how much of the decline is fewer births, how much is families leaving, and how much is the price of care; it measures each, and none of the links between them.
Cut the data your own way
The dashboard runs on the 37,000 census records of children under eighteen living in New York City households in 2015, 2019 and 2024. Pick a year and an age, then narrow by borough, the parents’ work arrangement, household income, tenure and race, and see how many children that is, how many live with all their parents at work or with a parent at home, what their households earn and how many rent, are below the poverty line or, at three and four, are in school.
Children by age, under the filters above
Loading the census records…
Every number here is a weighted tabulation of census microdata records, so the cross-tabulations it shows are measured relationships within one survey. Nothing is modelled. The headline tile carries an approximate 90% margin: a binomial margin on the record count, scaled by a design effect calibrated on the article's replicate-weight margins (click the ? on the tile). The article's charts carry the exact margins; treat any selection with a wide margin as indicative.
Year
The one-year census file: 2015 for the start of the decade, 2019 for the last year before the pandemic, 2024 the latest published. Each year is its own sample of about 15,000 children in the five boroughs.
Age of the child
Age at the survey. Single years under six, then 6 to 12 and 13 to 17. Under 3 and under 6 are shortcuts for the first three and six bands.
Borough
Where the child lives. Nothing here goes below the borough.
Parents
From the child's own census record: whether the child lives with two parents or one, and whether those parents are in the labor force (working or looking for work). A parent not in the labor force is at home for whatever reason; the census does not ask why. Not living with a parent means a child in a household headed by a grandparent, another relative or a non-relative.
Household income
The total income of the household the child lives in, in 2024 dollars.
Home
Whether the household owns its home, with or without a mortgage, or rents it.
Race or ethnicity
The child's, as reported: Hispanic of any race; the other groups are non-Hispanic.
All parents in the labor force
Among children living with a parent, the share whose resident parent or parents are all in the labor force: two working parents, or a lone parent who works or is looking for work. A weighted tabulation of the records in the selection, with an approximate 90% margin beside it (see the ± button).
Children, weighted estimate
The sum of the survey weights of the records in the selection: the Bureau's estimate of how many children these records stand for. Rounded to the nearest hundred. Each record in a one-year file stands for roughly a hundred children, so treat a small selection as an order of magnitude.
A parent not in the labor force
Among children living with a parent, the share living with at least one parent who is neither working nor looking for work.
One parent
Among children living with a parent, the share living with one parent rather than two.
Median household income
The median of the household incomes of the children in the selection, in 2024 dollars, interpolated within the income band the median falls in, so it is approximate.
Rented home
The share of children whose household rents its home.
Below the poverty line
The share of children whose family income is below the federal poverty threshold, as the census computes it, among children for whom it is computed.
Three- and four-year-olds in school
Among the three- and four-year-olds in the selection, the share enrolled in a public or private school in the past three months: nursery school, preschool or kindergarten at those ages. Shown only when the selection includes at least 30 such records.
By age
Each bar is the number of children in one age band under the filters above (the age filter itself is ignored here, so the bars always show the whole picture). Bands with fewer than 30 records in the selection are marked too few.
The ± figure
An approximate 90% margin of error on the headline share. The dashboard cannot carry the 80 replicate weights the article's charts use, so it estimates the margin as 1.645 × √(deff × p(1 − p) ÷ n): n is the number of census records in the selection and deff is the design effect, the ratio of the survey's true sampling variance to that of a simple random sample of the same size.
The design effect is calibrated from the article's own charts: for every chart cell, (replicate-weight margin ÷ binomial margin)², and the median is used. The note under the chart gives the effective sample size, n ÷ deff. For any cut the charts precompute, the chart's margin is the exact one.
Too few children
Fewer than 30 census records match, so the numbers would be noise. Widen a filter.
Questions this raises
How well do these numbers match the Bureau’s own?
Closely, and that is the check everything else rests on. The Bureau’s 2024 table reports 516,012 own children under six: 325,117 living with two parents (211,677 with both in the labor force, 91,369 with only the father, 17,402 with only the mother, 4,669 with neither) and 190,895 living with one parent (117,929 with a mother in the labor force, 40,555 with a mother who is not, 30,113 and 2,298 for fathers). Rebuilding the same rows from the 2024 microdata gives 512,908, 321,266, 211,008, 89,374, 17,988, 2,896, 191,642, 118,500, 40,202, 31,255 and 1,685, each inside the published Margins of error from replicate weights Each PUMS record carries 80 replicate weights alongside its main weight. A statistic is recomputed 80 times, once with each replicate, and the spread of those 80 answers around the main answer gives its standard error: variance = 4/80 × Σ(θr − θ)². The Census Bureau reports 90% margins, 1.645 standard errors, and every census margin in this article follows that convention.This is the Bureau’s own method (successive difference replication), so a margin here matches what the Bureau would publish for the same cut. . The 2019, 2021, 2022 and 2023 tables reproduce the same way, fourteen rows a year. The full comparison is in the Reproduce box and the reproduction table. Everything the table does not print, the ages, the boroughs, the incomes, the preschools, the nannies and the leavers, is built on the same records.
Which children are in the seven-in-ten, and which are not?
The published table, and the seven-in-ten figure built on it, count children living with at least one parent, as the child of the householder or in a subfamily: 512,908 of the 543,082 residents under six in the 2024 microdata. The other 30,000 or so are children in households headed by a grandparent, another relative or a non-relative without a parent present, about 26,000 or 4.8% of household children under six, and a few thousand in group quarters. Their parents’ employment is not on their record, so they cannot be sorted. Counted against all 543,082 under-sixes, the children with every resident parent in the labor force are about two thirds rather than seven in ten.
Where exactly do the families live, and what do they earn?
In 2024 Brooklyn had about 188,000 children under six, Queens 147,000, the Bronx 103,000, Manhattan 76,000 and Staten Island 30,000. As a share of each borough’s residents that is 7.2% in Brooklyn and 7.4% in the Bronx against 4.5% in Manhattan. Households with a child under six numbered 341,000, one household in ten citywide, from 12.8% of Bronx households to 5.9% of Manhattan’s. Their median incomes in 2024 dollars: Manhattan $258,000, Staten Island $126,000, Queens $113,000, Brooklyn $101,000, the Bronx $58,000. Counting children rather than households, 23% of the under-sixes live below the poverty line, 37% in the Bronx and 12% on Staten Island, and 70% live in rented homes, 81% in the Bronx and 39% on Staten Island. In 2015 there were 413,000 households with a child under six, 13% of all households, with a median income of $96,000 in 2024 dollars.
Who is the parent at home, and does salary come into it?
Mostly a mother, and often born abroad; income matters less than the first cut suggests. Of the roughly 90,000 parents of children under six who were out of the labor force in 2024, 84% were mothers. Sorted by household income, the share of mothers whose youngest is under six who are out of the labor force runs from 44% in households under $25,000 through 36%, 37%, 23% and 14% to 12% above $200,000. That measure contains the mother’s own earnings, so it partly sorts mothers by whether they work. Sorted instead by the income of the rest of the household, hers excluded, the shares are 21% under $25,000, 37% at $25,000 to $50,000, 35% at $50,000 to $100,000, 22% at $100,000 to $150,000, 24% at $150,000 to $200,000, 22% at $200,000 to $300,000 and 21% above $300,000: a hump in the middle and about a fifth at both ends. In 2015 the same series was 26%, 41%, 43%, 31%, 29%, 37% and 43%, so the fall since then is steepest at the top, from 43% to 21% where the rest of the household earns more than $300,000; those two figures rest on 217 and 193 mothers and carry margins of about six and a half and six points, so the decade’s fall is well clear of sampling noise. By borough the 2024 share ran from 32% in the Bronx and 30% in Queens to 20% in Manhattan; by race or ethnicity, about a third among Hispanic and Asian mothers and a fifth among white and Black mothers; 33% among foreign-born mothers against 21% among US-born ones. Fathers of small children are out of the labor force about 6% of the time, a share that has not moved, and mothers whose youngest child is under six are employed 68% of the time, against 60% in 2015. None of this says why a parent is at home; the census records the status, not the reason.
What happens in the first year after a birth?
The census asks every woman aged 15 to 50 whether she gave birth in the past twelve months, which finds about 90,000 new mothers in 2024. Of them 70% were in the labor force, 64% were employed and half were working 35 hours or more, and the median new mother was 33. In 2015 the figures were 63%, 57% and 41%. Someone on paid family leave from a job is employed in the census’s terms, so the employment share measures attachment to a job rather than hours at a desk in the baby’s first months, and it says nothing about who is with the baby. This is the one measure here that is asked of women who actually had a child in the year, rather than of different mothers whose youngest children happen to be different ages.
Who is minding the children under three?
Nobody knows from the census, and only partly from anything else. The census does not ask about care arrangements, so what it offers is the parents’ side only: of children under three living with a parent, seven in ten have every resident parent in the labor force, and about three quarters of mothers whose youngest is under three are in it. A parent in the labor force may be on leave, working from home, working a shift the other parent does not, or looking for work, so none of that says a child is in paid care. The national household education survey, which does ask, found in 2019 that 42% of American children under one and 55% of one- and two-year-olds were in at least one weekly nonparental care arrangement, relatives included; it publishes nothing for New York City. On the supply side the State Comptroller’s January 2026 report counts what the City pays for: about 6,400 children in the Department of Education’s infant and toddler programs, with 4,100 seats unfilled, and about 26,400 infant and toddler vouchers, which together reach about 13% of the city’s under-threes; the City Comptroller put voucher coverage at 29% of the roughly 108,000 income-eligible infants and toddlers in September 2024. Monthly vouchers in use by children under five rose from 29,615 in the 2023 fiscal year to 52,027 in 2025 and 64,129 in the first four months of 2026, and new vouchers for families not on cash assistance were paused in May 2025. From September 2026 the City’s first 2-K classes add about 2,000 free full-day seats for two-year-olds in school districts 6, 10, 18, 23 and 27 (Washington Heights and Inwood, the north-west Bronx, Canarsie and Brownsville, and Ozone Park and Richmond Hill); applications ran from 2 to 26 June, more than 5,700 families applied, and the City has said it will serve about 12,000 children in 2027. Everyone else is with a parent, a relative, a nanny, a babysitter, an unlicensed provider, or a licensed one paid privately, in proportions no public dataset measures.
What changed at three, and where?
The census records enrolment, not the program, so what it shows is public enrolment of three-year-olds rising from 23% in 2015 to 29% in 2019 and 44% in 2024, while private enrolment stayed near a fifth and the share not enrolled fell from 56% to 34%; the rise coincides with the City’s 3-K expansion, and the census cannot attribute any child’s seat to it. Four-year-olds were already mostly in school after pre-K for all: 81% enrolled in 2015 and 83% in 2024, with the public share up from 55% to 68% and the private share down from 26% to 15%. By borough, public enrolment of three-year-olds in 2024 ran from 38% in Manhattan and 39% in Brooklyn to 52% in the Bronx and 55% on Staten Island. By income, enrolment of three-year-olds is highest at the top, 87% above $300,000, and lowest between $25,000 and $50,000, at 51%, where a parent is more often at home. The State Comptroller’s administrative count for the 2025 fiscal year is consistent: 44,729 three-year-olds in 3-K, 53% of the age group, with 7,988 seats unfilled, and 56,184 in pre-K with 15,181 unfilled; it notes that the three-year-old population fell from 106,656 in 2020 to 85,059 in 2024, which raised the enrolment rate without adding children. The school register for 2025-26 shows 39,229 in 3-K and 55,497 in pre-K.
What does care actually cost, and who could pay it?
The published rates are the State’s ceilings for subsidised care in the five boroughs from October 2024: $500 a week for an infant in a day care centre, $450 for a toddler, $439 for a three- or four-year-old and $325 for a school-age child; $400, $350, $325 and $289 in a family or group family day care home. Times 52 weeks, as the City Comptroller states them, that is $26,000, $23,400, $22,828 and $16,900 in a centre and $20,800 in a home for an infant. The Comptroller’s own averages for 2024, from the same survey, were $26,000 for centre-based infant and toddler care and $18,200 for family-based care, up 43% and 79% since 2019, and it calculated that a family needs $334,000 to keep toddler centre care within 7% of income. The 7% line comes from the federal child-care subsidy rule of March 2024, which capped co-payments for subsidised families at that share of family income; the federal government rescinded the cap with effect from 13 July 2026, and the line is used here as the conventional yardstick it has become, not as a current requirement. Against the census family incomes of households whose youngest child is under three (about 166,000 households, median family income $108,000), the infant centre rate is within 7% of income for 13%, within 10% for 21%, within 20% for 45% and within 30% for 59%; the family day care rate for 18%, 27%, 53% and 66%. By borough, the 7% test passes for 44% of Manhattan’s families with a child under three, 14% of Brooklyn’s, 8% of Queens’, 4% of Staten Island’s and under 1% of the Bronx’s. Family income is the income of the householder and everyone related to them by birth, marriage or adoption, the measure the benchmark is defined on; it leaves out an unmarried partner, who may well be the child’s other parent. Using the whole household’s income instead, which brings the partner back in along with roommates and other unrelated adults, moves each share up by about a point (14%, 22%, 47% and 61% for the centre rate). What a family pays is a different number: subsidies, sibling discounts, part-time places, nanny shares and grandparents all lower it, and the census measures none of them.
Measured Tabulated from survey microdata. Every variable in the chart is observed in the same record, so the relationship shown is measured rather than modelled, and the ticks are 90% margins from the survey’s replicate weights.
How to read this, and what it cannot show
Children aged one to five who lived in the city a year earlier, by where they live now, 2015, 2019 and 2024, with 90% margins. Cells resting on fewer than 30 records are not drawn.
How many nannies are there really, and what do they earn?
More than the census finds. The 11,461 residents it counts as childcare workers employed by private households, with a margin of about 3,000, are the people who told the survey that their job is childcare and their employer is a household; that leaves out anyone who described the work differently, anyone who commutes in from outside the city, and some share of a workforce that is often paid in cash and often not a citizen. Treat the count as a floor and the profile as a sketch with wide margins: 99% women, 60% born abroad, 27% not citizens, a median age of 44, a median of 40 hours a week, a third self-employed, a fifth below the poverty line, and a median household income of $72,000. Their reported earnings, about $17 an hour and $33,000 a year at the median, are what respondents said they made, on or off the books, and include part-time babysitters; the rate a Brooklyn family pays an experienced full-time nanny is higher, and no public survey measures it citywide. Day care workers, 19,489 of them in 2024, report a median of $14 an hour and $20,000 a year, and 37% are below the poverty line; preschool and kindergarten teachers working in day care centres, 12,564, report $24 an hour and $49,000. The number of day care workers the census finds fell from 36,000 in 2015 to 19,000 in 2024, with a margin of about 4,000 on each, a fall that coincides with the move of three- and four-year-olds into DOE-run classrooms. Some of the measured decline could reflect workers shifting into school settings, where the census would file the same job under a different industry and occupation; the cross-sections cannot show whether that happened. The profile shares above also rest on the same 75 records: the foreign-born share carries a margin of about 14 points and the self-employed and non-citizen shares about 10, so read them as a sketch, not a census. The City Comptroller’s count of 32,917 employed child care workers, from the 2023 survey, sits between the 38,000 counted here across all settings and the 31,000 outside schools.
Which children leave, and what do the households they join look like?
In 2024 about 19,700 children aged one to five who had lived in the city a year earlier were living elsewhere in the United States, 4.3% of the age group, against 14,200 six-to-twelve-year-olds (2.2%) and 10,500 teenagers (2.2%); adults aged 25 to 44 left at 5.3% and adults over 45 at 1.9%. Among adults aged 25 to 44, those who now live with children left at 4.1% and those who now do not at 5.8%; because the household is recorded after any move, that compares people by the household they ended up in, not by whether they were parents before leaving, so it does not measure whether families or the childless were readier to go. By the borough they lived in, one-to-five-year-olds left Manhattan at 6.1%, the Bronx at 4.6%, Brooklyn at 4.3% and Queens at 3.3%, with Staten Island resting on too few records to say; by race or ethnicity, white children at 5.2%, Hispanic and Asian children at about 4% and Black children at 2.8%. The rates were 3.3% in 2015 and 4.8% in 2019, and the decade’s peak was in the 2020 and 2021 files, near 6%. Half of the 2024 young leavers went to the suburbs, about 3,500 each to the Lower Hudson Valley and northern New Jersey and 2,800 to Long Island; Florida took 946, Pennsylvania 916, the rest of the South 1,800 and the Midwest 1,500. The households the leaving children now live in are owner-occupied 52% of the time against 31% for the children who stayed, have a median income of $130,000 against $94,000, and are above $150,000 39% of the time against 35%; those are the households at the destination, which the census records, not the ones the families left, which it does not. The rates by household income now rest on eleven to twenty-nine leaver records a band and show no clear gradient. Arrivals ran the other way in smaller numbers: about 6,300 one-to-five-year-olds came from elsewhere in the country and 7,800 from abroad, for a net domestic loss of about 13,400 in the age group.
What do the population estimates, the births and the school register say about 2026?
The Bureau’s under-five estimates come in two vintages that the Bureau says not to combine, so each is read on its own. Within Vintage 2020, built on the 2010 census, the five boroughs’ under-fives went from 563,827 in July 2015 to 510,972 in July 2020, a fall of 9.4%, spread almost evenly across Brooklyn, Queens, the Bronx and Manhattan and barely touching Staten Island. Within Vintage 2025, built on the 2020 census, they went from 508,585 in July 2020 to 473,562, 456,422, 454,017, 463,236 and 459,741 in the Julys of 2021 to 2025, a fall of 9.6% over the five years, all of it by 2022; Manhattan fell 15.6% in that vintage, the Bronx 8.9%, Brooklyn 9.5%, Queens 7.8% and Staten Island 5.1%. The 2024 uptick coincides with the arrivals from abroad described in the migration piece. The Health Department’s count of live births to city residents fell from 121,673 in 2015 to 110,442 in 2019, dropped to 100,022 in 2020 and has stayed just under 100,000 since, 98,389 in 2023, the latest year published. The public-school register reaches furthest: kindergarten enrolment including charter schools was 68,828 in 2021-22, 67,276, 69,155 and 67,636 in the three years after, and 64,536 in 2025-26, the smallest cohort of the five; first grade with charters was 67,791 in 2025-26 against 70,546 four years earlier. The 2025 census file, which would carry the survey’s own view of 2025, has been delayed past its usual September release with no date announced.
Administrative Counts from an agency’s own records, such as turnstiles and toll plazas. They carry no sampling margin, but they count trips or transactions rather than people, and they cannot be cut by who the traveller is.
How to read this, and what it cannot show
One bar per year, registered live births to residents of the five boroughs wherever they occurred, from the Health Department’s Summary of Vital Statistics 2023. No margin.
Administrative Counts from an agency’s own records, such as turnstiles and toll plazas. They carry no sampling margin, but they count trips or transactions rather than people, and they cannot be cut by who the traveller is.
How to read this, and what it cannot show
One bar per school year, from the Department of Education’s audited register. Kindergarten is shown with and without charter schools; 3-K and pre-K are the DOE’s district and community-based seats.
Where this data goes quiet
Who minds a child under three on a weekday, and what the family pays for it. Why a parent is at home. Which parent a child belongs to, since the census records relationships to the householder only. Any mother followed from one year to the next: every age-of-youngest-child comparison is between different mothers. Nannies who live outside the city or describe their job another way. Anything below the borough. Why any family left, and what its household earned before it did. Infants in the migration flows, since the question is asked from age one. The 2-K seats and anything else after the 2024 survey. The year 2025 in the census, which is not yet published.
Under the hood: data, definitions, estimators and the full results
This is the methods note for everything above. It is deliberately more technical than the rest.
The published anchor. Census table B23008, own children under 18 in families and subfamilies by living arrangement and the employment status of parents, for New York city from the one-year survey: 2019 from the Bureau’s sequence-format summary file (sequence 101, start position 66), 2021 to 2023 from the table-based summary files, 2024 from the Census Reporter mirror. Fourteen rows are reproduced each year: own children under 18, under 6 and 6 to 17; and among the under-sixes, living with two parents, both in the labor force, father only, mother only, neither; living with one parent, with father in and not in the labor force, with mother in and not in the labor force; and among 6-to-17-year-olds, two parents both in the labor force. In the microdata the universe is children under 18 with a non-blank parents’-employment code (ESP), which the Bureau assigns to own children of the householder and to children in subfamilies, and each row is one code or a set of them. Every share built on that code, including the seven-in-ten, has that universe as its denominator; counts of all children under six include the rest.
Residents. The 2015 to 2024 one-year public-use microdata samples for New York, cut to the 55 microdata areas of the five boroughs, with 80 replicate weights per person and per housing unit, joined to their housing records for household income, family income, tenure, gross rent as a share of income, bedrooms and the presence of children. Children are residents under 18 (about 15,000 to 17,000 records a year); households are occupied housing units in the five boroughs (about 30,000 a year), with the housing unit’s replicate weights.
Derived variables. Arrangement groups the parents’-employment code: both in the labor force (code 1); two parents, one not in the labor force (2 and 3); neither (4); one parent in the labor force (5 and 7); one parent not (6 and 8); children under 18 in households with a blank code are not living with a parent. All resident parents in the labor force is codes 1, 5 and 7; a parent at home is 2, 3, 4, 6 and 8. A parent, for the adult measures, is a person with relationship code 20 to 24 (householder, spouse or partner) aged 16 or over in a household containing a child of the householder (codes 25 to 27) under 18; the youngest child’s age is the minimum age of those children. Employed is employment status 1, 2, 4 or 5; in the labor force adds 3; full time is employed with usual hours of 35 or more. Other household income is the household’s total income less the parent’s own total personal income, both adjusted to 2024 dollars. A new mother has fertility code 1. School enrolment among three- and four-year-olds is the school item: 2 public, 3 private, 1 not enrolled. The child-care workforce is employed people with occupation code 4600 (childcare workers), split by industry: 814 private households, 6244 child day care services, otherwise elsewhere; preschool teachers in day care are occupation 2300 in industry 6244; the 2015 to 2018 files carry the same codes. Hourly earnings are total earnings times the Bureau’s within-year factor and the New York-metro CPI to 2024 dollars, divided by usual weekly hours times weeks worked, for people with all three positive; the 2015 to 2018 files’ banded weeks are the extract’s midpoints. Household income is the housing record’s income adjusted the same way; family income is the housing record’s family income (FINCP), the income of the householder and everyone related to them. Rent burden is gross rent 30% or more of income among renters with a computed ratio under 101%; crowding is persons over bedrooms greater than two, a studio counted as half; poverty is the income-to-poverty ratio under 100 where computed. Race and ethnicity are Hispanic of any race, otherwise the census’s single race.
Leavers and rates. As in the migration piece: every record in the national one-year person file with migration state 36 and a five-borough migration PUMA a year earlier, now living elsewhere in the United States, joined to the household it lives in now. The out-migration rate is leavers over stayers, within-city movers and leavers, computed replicate by replicate among people aged one and over; the age bands are age at the survey. Net domestic flow of an age band is arrivals from elsewhere in the United States minus leavers, within one year’s file. Destinations use the current state and, within the study area, the region of the current microdata area.
Cost of care (computed). The State’s weekly maximum rate for county group 4 effective 1 October 2024 (day care centre $500 under 1½ years, $450 at 1½ to 2, $439 at 3 to 5; family and group family day care $400 under 2, $350 at 2, $325 at 3 to 5), times 52 weeks, compared with each household’s 2024 family income among households whose youngest child of the householder is under 3 and whose family income is positive; the share within a threshold is a household-weighted share with a replicate margin, and the same shares on household income are kept as a sensitivity. The 7% threshold is the March 2024 federal co-payment cap, rescinded effective 13 July 2026, used as a conventional yardstick. The rate is a parameter: the same calculation at the Comptroller’s survey averages ($26,000 centre, $18,200 family) gives the same centre result by construction and a family-care result between the two rates here.
Administrative series. Under-fives are the five counties’ age group 0 to 4 from the Bureau’s county characteristics files, Vintage 2020 (July 2010 to July 2020) and Vintage 2025 (July 2020 to July 2025, plus the April 2020 base); changes are computed within a vintage only, never across the two. Births are transcribed from Table PC1 of the Summary of Vital Statistics 2023. School enrolment is read from the Department of Education’s demographic snapshot workbook, citywide with and without charter schools. Voucher, seat and coverage figures are transcribed from the State Comptroller’s report 19-2026 and the City Comptroller’s January 2025 spotlight; the 2-K figures from the Mayor’s press releases of 2 June and 4 August 2026; the federal rule from the Federal Register of 12 May 2026.
Estimators. For any statistic computed with the full weight, the same statistic is recomputed with each of the 80 replicate weights and the variance is the Bureau’s successive-difference estimator, four-eightieths of the summed squared deviations of the replicate estimates from the full-weight one; margins are 90%, or 1.645 standard errors. Shares and rates are computed replicate by replicate; medians are weighted medians without a margin. A published row is reproduced if the difference is within the root of the summed squared margins, the Bureau’s test for a difference between two estimates. Chart cells resting on fewer than 30 records, or rates on fewer than ten leaver records, are labelled too thin rather than drawn.
Does it reproduce? Every one of the fourteen rows lands inside the published margin in 2019, 2021, 2022, 2023 and 2024. The year-by-year comparison is the reproduction table.
The full 2024 results. Children: 1,658,275 under 18, 543,082 ± 7,866 under 6, 264,391 under 3; own children under 6, 512,908. Arrangement of own children under 6: both parents in the labor force 41.1%, two parents with one at home 20.9% (mother at home 17.4%, father 3.5%), neither 0.6%, lone parent in the labor force 29.2%, lone parent not 8.2%; all resident parents in the labor force 70.3% against 63.5% in 2015 and 66.4% in 2019; not living with a parent, 4.8% of household children under 6. By age: all parents in the labor force 66.9% under 1, 73.1% at 1, 72.4% at 2, 70.2% at 3, 71.4% at 4, 68.1% at 5, 71.4% at 6 to 12, 73.3% at 13 to 17. Households: 3,379,652, of which 340,510 with a child under 6 (10.1%), 481,633 with children 6 to 17 only, 2,557,509 with none; medians $103,073, $87,612 and $79,470; renting 69.3%, 64.2%, 67.7%; rent-burdened 43.6%, 48.5%, 44.3%; crowded 32.8%, 20.8%, 4.6%. Parents whose youngest child is under 6: mothers 73.5% in the labor force, 68.3% employed, 49.9% full time; fathers 89.9% employed; 74,968 mothers and 14,812 fathers out of the labor force. Mothers out of the labor force by other household income, 2024 (2015): 21.1% (26.2%) under $25,000, 36.9% (40.9%), 35.3% (42.5%), 21.9% (30.7%), 24.0% (28.7%), 21.7% (36.7%), 20.7% (43.0%) above $300,000. New mothers 89,795: 69.6% in the labor force, 64.5% employed, 50.2% full time. Preschool: at 3, 65.6% enrolled, 43.8% public, 21.8% private; at 4, 82.7%, 67.5%, 15.2%. Workforce: private-household childcare workers 11,461 ± 2,972 (median $17.3 an hour, $32,983 a year, 40 hours, 59.8% foreign-born, 99.0% women, 34.5% self-employed, 19.5% in poverty); day care 19,489 ± 2,919 ($14.1, $20,202, 35 hours, 36.6% in poverty); elsewhere 7,237; preschool teachers in day care 12,564 ± 2,799 ($23.8, $49,475); all workers’ median hourly earnings $29.7. Leaving: out-migration rate 4.29% at ages 1 to 5, 2.20% at 6 to 12, 2.21% at 13 to 17, 5.31% at 25 to 44, 1.91% at 45 and over; adults 25 to 44 living with children now 4.1%, without 5.8%; net domestic flow of one-to-five-year-olds −13,412 ± 4,189 (6,282 arrived from elsewhere in the US, 7,847 from abroad, 19,694 left); destinations of the 19,694: suburbs 50.0%, elsewhere in New Jersey or Connecticut 7.6%, the rest of the South 9.0%, the Midwest 7.7%, Florida 4.8%, Pennsylvania 4.7%, California 3.8%. Cost: 165,672 households with a child under 3, median family income $108,227 (household income $116,473); the infant centre rate within 7% of family income for 13.3%, 10% for 21.1%, 20% for 44.7%, 30% for 59.4% (on household income 14.0%, 22.0%, 47.0%, 61.4%).
Rerunning it. The analysis script computes every figure and number above, the charts and the dashboard in one run from a fixed seed; its docstring is the long-form method, and the leaver extraction from the national files is a separate script named there. The companion dataset is the census records themselves: every child under 18, every parent and every childcare worker in the 2015, 2019 and 2024 files, residents and leavers, with their survey weights and the derived variables, so a weighted count of the children’s records within a year reproduces the headline counts. The build manifest names the version of this page the run was made for and the checksum of the script and of every file linked here, so a downloaded script can be checked against the numbers on the page.
Sources
- U.S. Census Bureau — Age of Own Children Under 18 Years in Families and Subfamilies by Living Arrangements by Employment Status of Parents (B23008), New York city, ACS 2024 1-year (ACS 2024 1-year tables, released 11 September 2025; the 1-year PUMS followed on 4 December 2025) — 516,012 own children under six; 211,677 living with two parents both in the labor force, 91,369 with two parents of whom only the father is, 40,555 with a mother who is not; the anchor reproduced from the microdata
- U.S. Census Bureau — the same table for 2019, 2021, 2022 and 2023 (1-year summary files) (ACS 2019, 2021, 2022 and 2023 1-year summary files) — 587,169 own children under six in 2019; every row reproduced within its margin in every year
- U.S. Census Bureau — ACS 2015–2024 1-Year PUMS, New York state files (residents) and United States files (leavers), with replicate weights (ACS 2015–2024 1-year releases; the 2020 file is the experimental release) — every count, share and margin labelled census; children carry their parents' employment status, adults their own occupation, industry, hours and earnings; family income is the Bureau's FINCP
- New York State Office of Children and Family Services — Child Care Assistance Market Rates effective October 1, 2024 (Attachment A to 24-OCFS-LCM-22) (Rates effective 1 October 2024, from the 2024 market rate survey) — county group 4 (the five boroughs), weekly: day care centre $500 under 1½ years, $450 at 1½ to 2, $439 at 3 to 5; family and group family day care $400 under 2, $350 at 2, $325 at 3 to 5; the table was read from the Day Care Council of New York's copy because the State's site blocks scripted retrieval
- Day Care Council of New York — Market Rates (the ACS/OCFS rate table as of October 1, 2024) (Rates effective 1 October 2024) — the same table; the page says the rates are the maximum a provider is paid by the State, not a market minimum or maximum
- Office of the New York City Comptroller — Spotlight: Child Care Affordability and the Benefits of Universal Provision (15 January 2025; 2024 costs, 2020–2023 population change) — average annual cost of infant and toddler care in 2024: $18,200 in family-based care and $26,000 in a centre; a family needs $334,000 to keep toddler centre care within 7% of income; 29% of about 108,000 income-eligible infants and toddlers received a voucher in September 2024; the population aged 0 to 3 fell 19.3% between 2020 and 2023
- U.S. Department of Health and Human Services, Administration for Children and Families — Restoring Flexibility in the Child Care and Development Fund, final rule (Federal Register, 12 May 2026) (Published 12 May 2026, effective 13 July 2026) — rescinds the March 2024 requirement that family co-payments for subsidised care be capped at 7 percent of family income; the 7% line is kept here as the conventional yardstick the Comptroller used
- Office of the New York State Comptroller — New York City Government Services: Child Care Services for Children Under Five (Report 19-2026) (January 2026; FY 2025 program data, 2024 population estimates) — the City served nearly 160,000 children under five in FY 2025, about 35% of the under-five population; 3-K enrolled 44,729, 53% of three-year-olds, with 7,988 seats unfilled; coverage available to about 86% of three- and four-year-olds and 13% of children under three; monthly vouchers in use by children under five rose from 29,615 in FY 2023 to 52,027 in FY 2025 and 64,129 in the first four months of FY 2026; new non-mandated vouchers paused in May 2025
- Office of the Mayor of New York City — Mayor Mamdani and Governor Hochul open 2-K applications in first four 2-K communities (press release, 2 June 2026) (2 June 2026) — 2,000 free 2-K seats for fall 2026 in school districts 6, 10, 18, 23 and 27; applications 2 to 26 June; most seats full-day, 8 a.m. to 6 p.m., 260 days a year; 12,000 families the following year
- Office of the Mayor of New York City — Mayor Mamdani and Governor Hochul extend 2-K offers to more than 2,000 children, announce more than 5,700 applications submitted (press release, 4 August 2026) (4 August 2026) — more than 2,000 offers after more than 5,700 applications, nearly three for every seat; the 2027 expansion to serve about 12,000 children, including Staten Island, to be announced later in the year
- U.S. Census Bureau, Population Division — County Population by Characteristics, Vintage 2025 (2020–2025) and Vintage 2020 (2010–2020) (Vintage 2025, released June 2026; Vintage 2020, released 2021) — residents under five in the five counties on 1 July: 563,827 in 2015 and 510,972 in 2020 within Vintage 2020; 508,585 in 2020 and 459,741 in 2025 within Vintage 2025; the Bureau advises against combining vintages, and no change is computed across them here
- NYC Department of Health and Mental Hygiene — Summary of Vital Statistics 2023, Table PC1 (2023 summary, the latest published) — live births to city residents: 121,673 in 2015, 110,442 in 2019, 100,022 in 2020, 98,389 in 2023
- New York City Public Schools — Demographic Snapshot 2021-22 to 2025-26 (2025-26 audited register) — kindergarten enrolment including charter schools 68,828 in 2021-22 and 64,536 in 2025-26; 3-K 34,740 and 39,229; pre-K 56,452 and 55,497
- National Center for Education Statistics — Early Childhood Program Participation: 2019 (NCES 2020-075REV) (2019 National Household Education Survey) — national context only: 42% of children under one, 55% of one- and two-year-olds and 74% of three- to five-year-olds were in at least one weekly nonparental care arrangement in 2019