

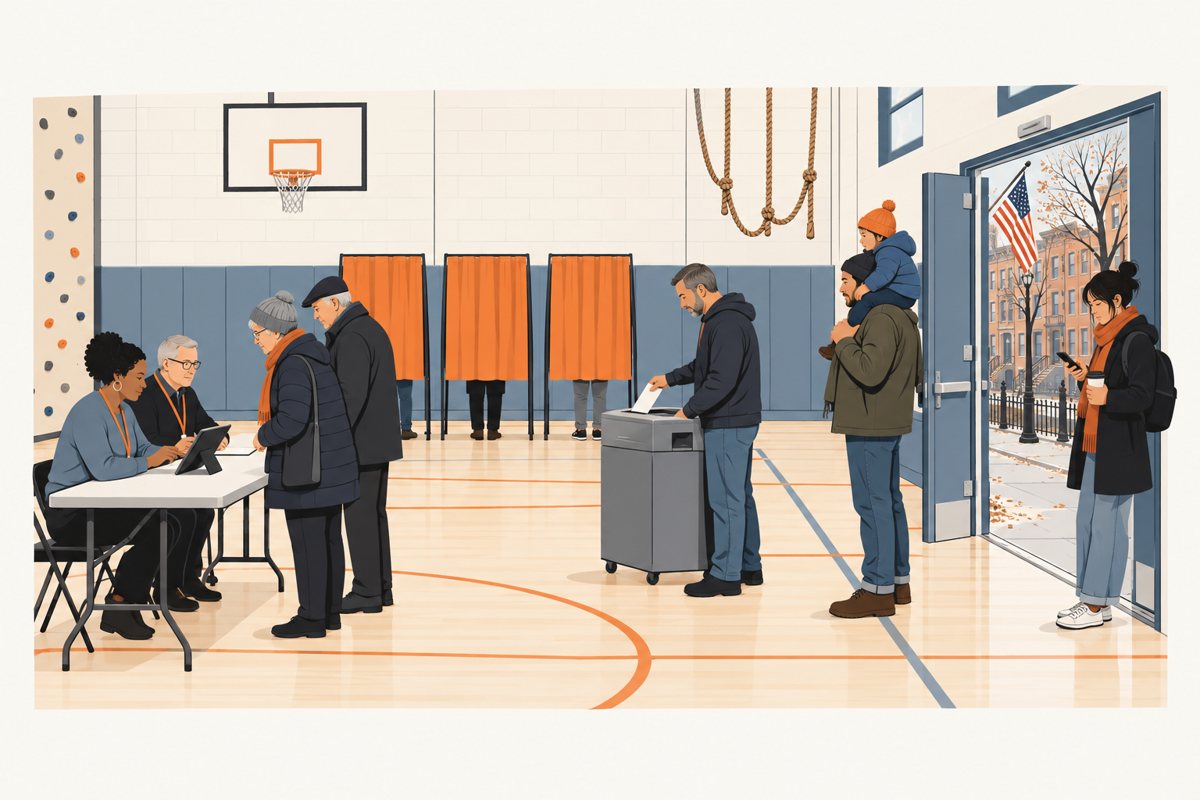
Until early voting began in 2019, 96% of New York City’s voters, the adult citizens who said they voted, told the Census Bureau’s survey they had voted in person on Election Day: one estimate pooled over the twelve elections from 1996 to 2018, with 2018 alone at 95%.
By the 2024 presidential election, about half did, 47%. Most of the rest voted in person before the day, at an early-voting site, or used a mail ballot.
However, the move away from the polls on the day hasn’t been steady. In the pandemic election of 2020, 43% voted on the day; in the 2022 governor’s race, 62% did.
This year’s race is for governor, as in 2022, and early voting began on Saturday 24 October. After its first weekend, the Board’s unofficial check-ins stood at 165,143, against 97,155 at the same point of the 2022 governor’s race and about as many as the 2025 mayoral race’s; a comparison of matching days only, with sites, hours and weather not held fixed.
Before 2019, nearly every New York City voter said they voted in person on Election Day
In every even-year November election from 1996 to 2018, at least 94% of the city’s voters said they voted in person on Election Day. About 3% voted by mail; a mail ballot counts as mail even if it was returned on Election Day.
Until 2019 nearly every New York City voter said they voted in person on Election Day; since 2020, between four and six in ten
Survey estimate An estimate from an official sample survey read without its microdata or replicate weights: the Bureau of Labor Statistics’ monthly survey of employers (benchmarked each year to unemployment-insurance records, with the latest months preliminary), or the monthly household survey pooled by period. It carries sampling error that the publisher estimates separately; no margin is drawn here, and month-to-month wiggles are mostly noise.Adult citizens in New York City who said they voted, by how they voted, every even-year November election 1996-2024
The interactive chart needs JavaScript; its numbers are in the table below.
How to read this, and what it cannot show
Three lines, one per way of voting. Hover or tap a point for its share and the survey’s margin of error.
The numbers behind this chart
About these numbers. What voters told the Census Bureau after each election; a voter who did not say how counts among the voters and in none of the three lines. New York had no early voting before 2019; an absentee ballot needs an excuse, and in 2020 fear of COVID counted as one; early mail ballots began in 2024. One question to 2002, two from 2004 (in person or by mail; on Election Day or before).
| Group | 1996 | 1998 | 2000 | 2002 | 2004 | 2006 | 2008 | 2010 | 2012 | 2014 | 2016 | 2018 | 2020 | 2022 | 2024 |
|---|---|---|---|---|---|---|---|---|---|---|---|---|---|---|---|
| In person on Election Day | 97% ± 1.1% | 96% ± 1.2% | 97% ± 0.9% | 97% ± 1.1% | 95% ± 1.6% | 98% ± 1.1% | 95% ± 1.6% | 98% ± 1.1% | 96% ± 1.4% | 97% ± 1.6% | 94% ± 1.5% | 95% ± 1.8% | 43% ± 4.2% | 62% ± 4.8% | 47% ± 4.5% |
| In person before Election Day | 0.2% ± 0.2% | 0.8% ± 0.6% | 0.1% ± 0.2% | 1.1% ± 0.7% | 0.2% ± 0.3% | 0.2% ± 0.3% | 0.7% ± 0.6% | 0.3% ± 0.4% | 0.5% ± 0.4% | 0.8% ± 0.8% | 1.1% ± 0.7% | 0.6% ± 0.5% | 30% ± 3.9% | 23% ± 4.0% | 33% ± 4.2% |
| By mail | 2.8% ± 1.0% | 2.4% ± 0.9% | 1.9% ± 0.7% | 1.6% ± 0.8% | 3.8% ± 1.5% | 1.9% ± 1.1% | 3.5% ± 1.2% | 2.0% ± 1.0% | 3.7% ± 1.3% | 2.0% ± 1.2% | 4.2% ± 1.2% | 4.2% ± 1.7% | 27% ± 3.8% | 13% ± 3.3% | 18% ± 3.2% |
Then came early voting. “In January, early voting was passed by the state legislature for the November 5th general election; allowing voters the opportunity to cast their ballot up to nine days prior to the regular Election Day, including two weekends,” the Board’s 2019 report says.
Then came the pandemic. More mail ballots came in that year, the Board’s 2020 report says, after the Governor’s order and later legislation “allowed fear of COVID as an excuse to request an absentee ballot”. By its own rough account, November’s general election split “one-third of the voters returning absentee ballots, one-third voting during the 9-day Early Voting period, and one-third voting on November 3rd, Election Day”.
Early voting’s share of the ballots rises and falls from race to race
The Board of Elections’ own counts, which carry no sampling error, move the same way as the survey, though they don’t match its exact split (the questions below). Between the two mayoral races, early voting’s share more than doubled, from 15% of the ballots in 2021 to 33% in 2025; in these elections the presidential years ran higher still, and the 2022 governor’s race lower.
A check-in is a voter signed in at an early-voting site; the Board posts them at the close of each day, unofficial until it certifies the count. The 2022 governor’s race ended its nine days at 432,634.
After 2 days of early voting, 165,143 New Yorkers had checked in
Administrative Counts from an agency’s own records: the calls, inspections, trips or transactions it logs. They carry no sampling margin, but they count events rather than people, and they can be cut only by what the agency records about each one.Early-voting check-ins at the close of each day, running total, New York City, every general election with a governor, president or mayor at the top of the ballot, 2020-2025, and 2026 so far, thousands
The interactive chart needs JavaScript; its numbers are in the table below.
How to read this, and what it cannot show
Each line is one election; the higher it ends, the more voters checked in early. Hover or tap a point for the day’s count.
The numbers behind this chart
About these numbers. The Board of Elections' unofficial check-ins at the close of each day, as its page printed them; 2020 to 2025 from the Internet Archive's copies. Early voting runs nine days, ending the Sunday before Election Day. 2023, a Council year, is left out.
| Group | Day 1 | Day 2 | Day 3 | Day 4 | Day 5 | Day 6 | Day 7 | Day 8 | Day 9 |
|---|---|---|---|---|---|---|---|---|---|
| 2020 (presidential) | 94 | 194 | 315 | 458 | 595 | 702 | 840 | 978 | 1,119 |
| 2021 (mayoral) | 15 | 31 | 45 | 55 | 73 | 92 | 109 | 135 | 170 |
| 2022 (governor's) | 50 | 97 | 128 | 172 | 213 | 247 | 284 | 346 | 433 |
| 2024 (presidential) | 140 | 258 | 385 | 496 | 602 | 701 | 826 | 940 | 1,089 |
| 2025 (mayoral) | 79 | 164 | 223 | 298 | 372 | 399 | 480 | 584 | 735 |
| 2026 (governor's) | 86 | 165 | – | – | – | – | – | – | – |
Mail ballots are a smaller part: 7% of the Board’s count in 2025. The Board’s 2024 report says “New Yorkers can now vote via early mail ballot”; its summaries print no column for those ballots, so we take them to be in the mail count, an inference. The three kinds don’t cover every ballot: affidavit ballots, a few in every hundred, are in none of them.
The Bronx casts the smallest share of its ballots early or by mail, Manhattan the largest
In the Board’s counts, early and mail ballots together made up 31% of the Bronx’s ballots in the 2025 mayoral race and 47% of Manhattan’s. The Bronx’s share was the smallest and Manhattan’s the largest in each of the last three citywide races, with a governor, president or mayor at the top of every ballot.
The Bronx votes early or by mail least and Manhattan most, in each citywide race
Administrative Counts from an agency’s own records: the calls, inspections, trips or transactions it logs. They carry no sampling margin, but they count events rather than people, and they can be cut only by what the agency records about each one.Ballots cast early in person or by mail, share of each borough's ballots, 2022 governor's race, 2024 presidential race, 2025 mayoral race
The interactive chart needs JavaScript; its numbers are in the table below.
How to read this, and what it cannot show
Each row is a borough and each dot a race; the figure at the right is 2025. Hover or tap a dot for its share.
The numbers behind this chart
About these numbers. The Board of Elections' yearly turnout summaries: early ballots and mail ballots (the absentee and military, federal and federal write-in columns) over every ballot counted in the borough. Counts, not a sample: no margin.
| Group | 2022, governor | 2024, president | 2025, mayor |
|---|---|---|---|
| Bronx | 26% | 39% | 31% |
| Brooklyn | 29% | 49% | 40% |
| Manhattan | 39% | 58% | 47% |
| Queens | 27% | 45% | 38% |
| Staten Island | 31% | 54% | 41% |
By age, voters 65 and over reported voting by mail more often than those 45 to 64 in each election surveyed since 2020: 21% against 12% in 2024. These are differences between groups of respondents, not the habits of the same people, and the gaps clear the approximate margins only narrowly.
Among voters under 30, 30% reported voting by mail in 2024; in the 2022 governor’s race their share was about the same as the middle-aged group’s, too close to give a direction, on a small sample (how sure, below).
Voters 65 and over report voting by mail more than those 45 to 64, in each election surveyed since 2020
Survey estimate An estimate from an official sample survey read without its microdata or replicate weights: the Bureau of Labor Statistics’ monthly survey of employers (benchmarked each year to unemployment-insurance records, with the latest months preliminary), or the monthly household survey pooled by period. It carries sampling error that the publisher estimates separately; no margin is drawn here, and month-to-month wiggles are mostly noise.Adult citizens in New York City who said they voted by mail, by age, 2020, 2022 and 2024 elections
The interactive chart needs JavaScript; its numbers are in the table below.
How to read this, and what it cannot show
Each row is an age group and each dot an election; the figure at the right is 2024. Hover or tap a dot for the survey’s margin of error.
The numbers behind this chart
About these numbers. What voters told the Census Bureau; it reports more mail voting than the Board of Elections counts. Margins clustered on the household, approximate.
| Group | 2020, president | 2022, governor | 2024, president |
|---|---|---|---|
| 18 to 29 | 34% ± 8.6% | 9.6% ± 6.0% | 30% ± 8.7% |
| 30 to 44 | 24% ± 6.1% | 11% ± 5.4% | 13% ± 5.3% |
| 45 to 64 | 21% ± 5.5% | 9.6% ± 5.6% | 12% ± 4.5% |
| 65 and over | 33% ± 7.9% | 19% ± 6.2% | 21% ± 6.3% |
Election Day still takes the most ballots, and mail the fewest
“Most early voters wait for the last weekend.” No, not in the elections shown. The Saturday and Sunday before Election Day took 34% of the nine days’ check-ins in 2022 and 35% in 2025, and about a quarter in the presidential years.
“Mail voting has taken over.” No, not in the Board’s latest count: mail ballots were 7% of 2025’s ballots, against 33% cast early in person. The Board described 2020 as a rough three-way split, not a count of equal thirds.
“Election Day doesn’t matter anymore.” Its polls still take the largest single share: in the 2025 mayoral race, 58% of the ballots were cast there, more than early and mail together. How much it matters is not something these counts measure.
Of the Board’s summaries from 2022 to 2025, only 2024’s had early and mail ballots together, 49%, slightly ahead of the day’s 47%.
The count after 3 November will settle this year’s split, not what caused it
Early voting runs to Sunday 1 November. Until then a mail ballot can also be dropped off at an early-voting site in your county; on 3 November, at an Election Day poll site until 9pm; or it can be posted with a postmark no later than 3 November, the Board’s calendar says.
The Board’s certified count will then show how many ballots arrived each way. It won’t show how many voters these options added: that needs an estimate of what would have happened without them, which neither the Board’s counts nor the survey’s next file can supply on its own.
Questions this raises
Does the survey’s split match the Board’s count?
Not exactly. People tell the survey they voted by mail more often than the Board counts mail ballots: 13% of the city’s voters in 2022 against 7% of the ballots, and 18% in 2024 against 11%.
Early voting runs the other way: 33% of voters in 2024 against 39% of the ballots. In 2020, the survey’s 43% on Election Day sits above the Board’s rough description of a third.
The two also cover different people: the survey asks civilians outside institutions, one household member may answer for the others, and the Board’s mail count includes military ballots. These are reasons the two aren’t like for like, not a reconciliation of them. So we use the survey for the long view and for who votes how, and the Board’s counts for how many ballots came in each way, and never add the two together.
Are early check-ins the same as early ballots?
Almost. A check-in is a voter signed in at an early-voting site; a ballot is what the Board counts. After each election, the nine days’ check-ins came within 0.2% of the early ballots in the Board’s annual summary, in every year from 2022 to 2025.
How sure are these numbers?
The Board’s counts are counts, with no sampling error. The survey’s are estimates from between 429 and 975 voters in the city a year, with ranges at the 90% level the Census Bureau uses.
From the years before 2019 to the 2022 governor’s race, Election Day’s share fell by between 28.7 and 38.4 points; to 2024, by between 44.8 and 53.7.
2024’s own share carries a margin of about 4 points either way, so it could sit a little above or below half.
The margins are clustered on the household and leave out the survey’s geographic clustering, so they may be too narrow. For the 2024 mail shares by age, the Census Bureau’s own approximation gives somewhat wider margins than ours; that checks the ranges, not the shares (the check is in the results). The age gaps that clear zero do so by small margins, and the 2022 reading for voters under 30 rests on 63 records.
About 2% of the voters in 2022 and 2024 didn’t say how they voted; they count among the voters and in none of the three ways.
Under the hood
The survey. The Current Population Survey’s November Voting and Registration Supplements, every even-year election from 1996 to 2024: adult citizens in the five boroughs who said they voted, the survey’s final weight; it covers the civilian population outside institutions, and one household member may answer for the others. The 96% before 2019 pools the twelve elections of 1996 to 2018 in one estimate, so elections with more weighted voters count for more; a mail ballot counts as mail whenever it was sent, so “in person on Election Day” is the measure throughout. To 2002 one question asked how they voted (in person on Election Day, in person before it, or by mail); from 2004 two (in person or by mail; on Election Day or before it). Every column read from the fixed-width years is checked against its layout, and the same reading of the 2024 file reproduces the Bureau’s own table of the nation’s voters by method. Margins are 90%, clustered on the household, approximate.
The Board’s counts. Early check-ins at the close of each day, as the Board’s page printed them, for 2026 and, from the Internet Archive’s copies, every general election since 2020; each day’s boroughs add to the total the Board prints. Ballots by kind and borough from its yearly summaries, 2022 to 2025, whose kinds add to each borough’s turnout (checked in the build): mail is the sum of the summaries’ absentee and military, federal and federal write-in columns, which we take to hold the early mail ballots too, since the summaries print no column for them, an inference rather than a Board definition; affidavit ballots, a few in every hundred, are counted in none of the three kinds.
Code and checks. One script, analysis.py (linked below), produces every figure and chart, and checks the survey’s layouts, the Bureau’s published tables, the check-ins’ sums and each quoted passage. The dataset cards behind it (cps_voting, nyc_boe_turnout) list the traps.
Continue exploring New York
In New York City's midterms, the gap in reported voting between the oldest and youngest adult citizens widens to 19 points, from 12 in presidential years
In New York's last four midterms, 28% of adult citizens under 30 said they voted, against 47% of those 65 and over: a 19-point gap, 12 in presidential years.
New York City's mayoral turnout nearly doubled in 2025, to 39 in every hundred adult citizens, the most for a mayor since 1993
Two million ballots in the 2025 mayoral election, the most for a mayor since 1969: 39 per hundred adult citizens, nearly double 2021's and above any mayoral race since 1993.
- Explore this dataset: the data and the code behind every number above.
- All articles · Search · RSS
SparkyData Weekly
Every week, the most surprising things New York's public data reveals, and the evidence behind them.
Free, weekly, and one click to leave. Your address is held by Buttondown, which sends it; see the privacy policy.
Sources
- U.S. Census Bureau and Bureau of Labor Statistics — Current Population Survey, November Voting and Registration Supplements (November 1996 to November 2024, every even year) — Whether each adult citizen said they voted, and how: in person on Election Day, in person before it, or by mail
- U.S. Census Bureau — Table 4b, Reported Voting and Registration, for States (November 2018 and 2024), and Table 14, Method of Voting (November 2024) (The November 2018 and November 2024 tables) — New York State's published rates and the nation's voters by method, reproduced from the files
- National Bureau of Economic Research — CPS November supplement files and the 1996 data dictionary (Retrieved 18 October 2026) — The Census Bureau's 1996-2008 public-use files, which the Bureau's own server no longer holds
- NYC Board of Elections — Early Voting Check-Ins (The 2026 general election to date; the 2020-2025 general elections from the Internet Archive's copies of the page, retrieved 24 October 2026) — Unofficial check-ins at early-voting sites, by borough, at the close of each day
- Board of Elections in the City of New York — Annual Reports 2019, 2020 and 2022-2025 (Calendar years 2019 to 2025; retrieved 18 and 24 October 2026) — Ballots by kind and borough (early, election day, mail) for 2022-2025, ballots in every general election, and the Board's accounts of early voting's start, the 2020 absentee ballots and early mail ballots, quoted
- NYC Board of Elections — All Important Dates (General Election, 3 November 2026) (Read 18 October 2026) — The ways and deadlines to return a mail ballot for the 3 November 2026 general election
How to cite
Reference
BibTeX
Quote the version: a correction bumps it, and the corrections log says what changed. Charts can be embedded from the “Embed this chart” link under each one.