
Everyone who drives into Manhattan, takes a cab below 60th Street or waits on a crosstown bus has a view on the congestion toll. A natural question twenty months in is whether the traffic is creeping back.
On the toll’s first anniversary, the governor’s office put a number on its first year: 27 million fewer vehicles had entered the zone, an 11 percent reduction. That figure sets the MTA’s count of the vehicles that did enter against a baseline built from counts in earlier years, so the open data can check the first half of it but not the second. What the open data can do is compare the toll with itself, and with the traffic before it.
The tolled zone is Manhattan south of 60th Street, less the FDR Drive and West Side Highway; with those two highways it is the area traffic planners have counted for decades, which we’ll call the core. A car with an E-ZPass pays $9 to enter at peak and a quarter of that overnight, while taxis and for-hire cars licensed by the taxi commission are eligible to pay a smaller charge on each trip instead, collected from the passenger.
Here’s the short answer. At the door, there is no sign of a rebound: through mid-September 2026, fewer vehicles are entering the zone than in the same months of its first year. But a count at the door is not a measure of congestion. How fast the traffic inside moves depends on how many vehicles are there at once, how far they drive and how much room they have, and the measures of speed we have answer different questions and point different ways.
That matters to anyone who pays the toll and to everyone who rides a bus or a cab through the core. The toll is scheduled to rise to $12 in 2028, so what it does to the traffic inside, and not only to the count at the door, is a question with a price on it.
Claims about the toll often rest on different measures, so let’s take them one at a time. We read the MTA’s counts from the toll’s cameras for every day since it began, and the yearly count of vehicles entering the core kept by the region’s transportation planning council, NYMTC, back to 1990. For speed we set the published measures side by side, and for what fills the streets we use the taxi commission’s trip reports. Every chart is interactive, and the data and code are at the end.
Fewer vehicles are entering the zone than in its first year
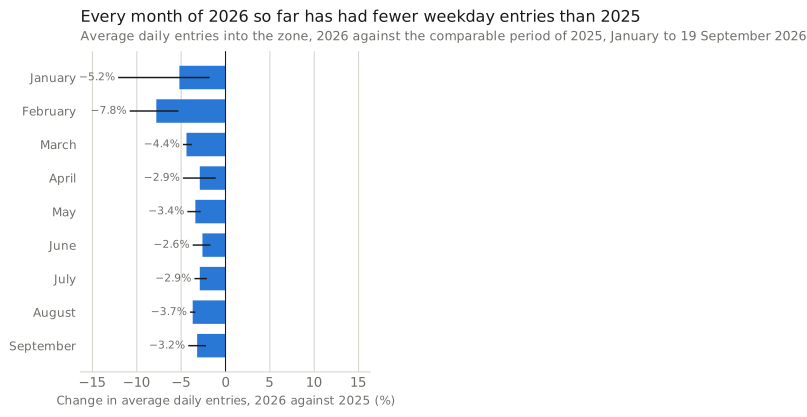
In the toll’s first year, about 500,000 vehicles entered the zone on an average weekday. From March to mid-September 2026, weekday entries ran 3.4% below the comparable period of 2025, and every month of 2026 so far has come in lower than the same month a year earlier.
That is about 17,000 fewer vehicles a day. The comparison starts in March, after the two winter snowstorms, and leaves out only holidays, on a calendar fixed in advance. Because both years come from the same cameras, this is the firmest finding here.
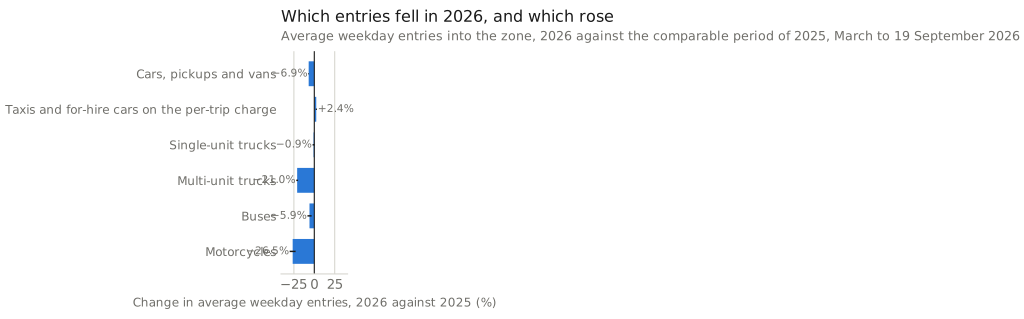
What fell was cars, pickups and vans, down 7% on weekdays. The MTA’s taxi and for-hire class, the cabs and app-based cars billed per trip, rose 2%, and it makes up more than a third of weekday entries. In the chart, the 2026 line sits under 2025’s all year; switch to taxis and for-hire cars and, from April, it sits on top.
On weekdays, every month of 2026 so far has had fewer entries than a year earlier
Administrative Counts from an agency’s own records, such as turnstiles and toll plazas. They carry no sampling margin, but they count trips or transactions rather than people, and they cannot be cut by who the traveller is.Average daily entries into the Congestion Relief Zone by month, 2025 and 2026 (to 19 September 2026)
The interactive chart needs JavaScript; its numbers are in the table below.
How to read this, and what it cannot show
One line per year, one point per month, averaged over the days of each month with holidays left out, and in January and February 2026 the two snowstorms. The toll’s cameras count vehicles entering the zone, Manhattan south of and including 60th Street, less the FDR Drive and West Side Highway; a vehicle entering twice counts twice. The classes are the MTA’s: cars, pickups and vans leave out the taxis and for-hire cars billed through the per-trip charge, which make up their own class, and a taxi or for-hire car not billed that way is counted in its ordinary class. In both years January starts on the 5th, the toll’s first day, and September runs to the 19th; 2025’s later months are whole. The month-by-month changes with their ranges are in the questions at the end.
MTA toll-gantry detections of vehicles entering the zone (Manhattan south of and including 60th Street, less the FDR Drive and West Side Highway), averaged over the days of each month with holidays left out, and in January and February 2026 the two snowstorms. Where the two years overlap they cover the same days: January from the 5th, the toll's first day, and September to the 19th in both years; 2025's later months are whole. Cars, pickups and vans are the MTA's class 1, which leaves out the taxis and for-hire cars billed through the per-trip charge; those make up the taxi and for-hire class, and one not billed that way is counted in its ordinary class. Peak hours are 5 a.m. to 9 p.m. on weekdays and 9 a.m. to 9 p.m. at weekends. The gantries count vehicles, not people: a vehicle entering twice counts twice.
The numbers behind this chart
| Group | Jan | Feb | Mar | Apr | May | Jun | Jul | Aug | Sep | Oct | Nov | Dec |
|---|---|---|---|---|---|---|---|---|---|---|---|---|
| 2025 | 490,704 | 496,892 | 503,382 | 511,408 | 526,429 | 512,701 | 504,995 | 494,662 | 517,065 | 515,155 | 511,631 | 512,817 |
| 2026 (to 19 September 2026) | 465,225 | 457,887 | 481,422 | 496,758 | 508,368 | 499,273 | 490,468 | 474,988 | 500,329 | – | – | – |
Those are counts at the door. They say that fewer vehicles are crossing into the zone; they don’t say how the traffic inside is moving.
How fast the core moves depends on the measure
The city’s own indicator is the average speed of yellow taxis carrying passengers on weekday daytimes, averaged over a fiscal year from July to June. It fell from 6.9 mph in the fiscal year the toll began to 6.5 mph in the first one wholly under it, its lowest reading in the city’s open records, which reach back to fiscal 2009.
That indicator follows one shrinking fleet. Yellow taxis made about 128,000 trips a day citywide in June 2026, against 231,000 in June 2019, as riders moved to app-based cars, so the trips that remain may be a different mix of places and times, and a change in that mix can move the average on its own.
The state’s before-and-after figures go the other way. Weekday vehicle speeds in the zone were up 4% in 2025 on 2024, the governor’s office reported at the toll’s anniversary, and buses in the zone were up 2.3%, though the MTA’s own bus data show them slowing again in 2026.
A working paper by researchers at Yale, Stanford and Google, revised in August 2026 and not yet peer-reviewed, asks a third question. It compares speeds on Google Maps in New York with five large cities without a congestion toll, and estimates that speeds in the zone during the tolled hours were about 11% higher than they would have been without the toll, a gain that eased after the first months but held through June 2026; roads outside the zone got faster too.
These answer different questions. A level asks how fast one kind of traffic moved; a before-and-after asks how a year compares with the year before; the working paper asks how the core compares with a New York that never got the toll. So the core can be slower than last year on one fleet’s measure yet faster than it would have been without the toll, and no single figure settles whether its traffic got faster.
Fewer entries have not, on their own, meant faster streets
A count at the door is a flow. What slows a street is how many vehicles are on it at once, how far each drives while inside and how much room they have, and none of those has to move with the number coming in.
The toll’s own counts hint at why. Entries of cars, pickups and vans fell while the taxi and for-hire class rose, and a cab or an app-based car may spend much of its day driving inside the core between fares; a car that comes in once and parks counts once. Across the city, app-based cars carry about 700,000 trips a day, as many as in 2019, while yellow taxis carry far fewer.
App rides grew to about 700,000 a day while yellow taxi trips fell by more than half
Administrative Counts from an agency’s own records, such as turnstiles and toll plazas. They carry no sampling margin, but they count trips or transactions rather than people, and they cannot be cut by who the traveller is.Trips a day in June of each year, citywide, 2010 to 2026
The interactive chart needs JavaScript; its numbers are in the table below.
How to read this, and what it cannot show
One point per June, citywide, from the taxi commission’s monthly reports. The app companies (Uber, Lyft and, until they stopped, Via and Juno) are reported from 2015, green cabs from their start in August 2013. June 2020 is the pandemic low. These are trips across the city: the commission does not publish them for the zone, and a trip is neither an entry into the zone nor a mile driven inside it.
TLC monthly data reports, average trips a day in June. The app companies' trips are reported from 2015 (the TLC groups them as high-volume for-hire services back to January 2015; for-hire trip records are complete from April 2015), green cabs from their start in August 2013. June 2020 is the pandemic low. Citywide trips: the TLC does not publish these counts for the zone alone.
The numbers behind this chart
| Group | 2010 | 2011 | 2012 | 2013 | 2014 | 2015 | 2016 | 2017 | 2018 | 2019 | 2020 | 2021 | 2022 | 2023 | 2024 | 2025 | 2026 |
|---|---|---|---|---|---|---|---|---|---|---|---|---|---|---|---|---|---|
| App-based ride-hail (Uber, Lyft, Via, Juno) | – | – | – | – | – | 102,793 | 242,233 | 420,017 | 626,423 | 700,036 | 251,696 | 498,685 | 592,656 | 645,549 | 670,772 | 662,265 | 707,670 |
| Yellow taxis | 494,137 | 503,152 | 503,139 | 479,148 | 460,393 | 410,831 | 371,257 | 321,877 | 290,362 | 231,335 | 18,326 | 94,462 | 118,213 | 109,766 | 116,772 | 142,320 | 127,837 |
| Green cabs | – | – | – | – | 44,590 | 54,628 | 46,817 | 32,544 | 24,610 | 15,690 | 2,103 | 2,891 | 2,456 | 2,184 | 1,805 | 1,602 | 1,439 |
The long record shows the same gap between the door and the street. Each fall, NYMTC counts the vehicles crossing into the core on a typical weekday: about 836,000 in 1998 and about 620,000 in 2024. On the crossings it has counted the same way throughout, the fall is about a quarter.
Fewer vehicles have been coming into the core since the late 1990s
Administrative Counts from an agency’s own records, such as turnstiles and toll plazas. They carry no sampling margin, but they count trips or transactions rather than people, and they cannot be cut by who the traveller is.Vehicles entering Manhattan south of 60th Street on a fall business day, 24 hours, 1990 to 2024
The interactive chart needs JavaScript; its numbers are in the table below.
How to read this, and what it cannot show
One point per count year; there is no count for 1991. Autos, taxis, vans and trucks entering in 24 hours on a typical fall weekday, counted by road tubes at 60th Street and on the East River bridges over two weeks in October and by toll transactions at the Hudson tunnels. Buses are counted apart and left out, and app-based cars are not separated from autos. NYMTC lost most of its 1999 files on 11 September 2001, so the 1999 point rests on partial data. The line breaks at 2021, when NYMTC stopped counting vehicles that pass over the zone on the Queensboro Bridge’s upper ramp. NYMTC flags its 2018 Queensboro count as low, and a later video count showed the 2019 Brooklyn Bridge count was too high.
NYMTC Hub Bound counts: road tubes at 60th Street and on the East River bridges over two weeks in October, toll transactions at the Hudson tunnels. Buses are counted apart and left out; app-based for-hire cars are not separated from autos. There is no count for 1991, and NYMTC lost most of its 1999 files on 11 September 2001, so the 1999 point rests on partial data. From 2021 the Queensboro Bridge count leaves out vehicles that pass over the zone on the bridge's upper ramp, so the line breaks there. The 2019 Brooklyn Bridge count was later found to be too high by a video count, so 2019 is overstated, and NYMTC flags its 2018 Queensboro count as low. NYMTC's own long table prints wrong totals for 2023 and 2024; the one-year tables are used for both.
The numbers behind this chart
| Group | 1990 | 1992 | 1993 | 1994 | 1995 | 1996 | 1997 | 1998 | 1999 | 2000 | 2001 | 2002 | 2003 | 2004 | 2005 | 2006 | 2007 | 2008 | 2009 | 2010 | 2011 | 2012 | 2013 | 2014 | 2015 | 2016 | 2017 | 2018 | 2019 | 2020 | 2021 | 2022 | 2023 | 2024 |
|---|---|---|---|---|---|---|---|---|---|---|---|---|---|---|---|---|---|---|---|---|---|---|---|---|---|---|---|---|---|---|---|---|---|---|
| Every crossing | 761,000 | 776,254 | 760,357 | 754,688 | 772,426 | 776,000 | 809,000 | 836,000 | 844,000 | 824,538 | 688,679 | 784,859 | 809,598 | 814,000 | 798,000 | 794,000 | 783,000 | 740,000 | 749,000 | 767,000 | 747,899 | 740,306 | 735,641 | 719,021 | 724,170 | 708,900 | 698,089 | 698,720 | 727,934 | 579,560 | – | – | – | – |
| Every crossing, Queensboro upper ramp left out (from 2021) | – | – | – | – | – | – | – | – | – | – | – | – | – | – | – | – | – | – | – | – | – | – | – | – | – | – | – | – | – | – | 597,301 | 633,338 | 629,889 | 618,970 |
| 60th Street, with the FDR Drive and West Side Highway | – | – | – | – | – | – | – | – | – | – | – | – | – | – | – | – | – | – | – | – | – | – | – | – | – | – | – | – | – | – | – | – | – | – |
| Brooklyn | – | – | – | – | – | – | – | – | – | – | – | – | – | – | – | – | – | – | – | – | – | – | – | – | – | – | – | – | – | – | – | – | – | – |
| Queens | – | – | – | – | – | – | – | – | – | – | – | – | – | – | – | – | – | – | – | – | – | – | – | – | – | – | – | – | – | – | – | – | – | – |
| Queens, Queensboro upper ramp left out (from 2021) | – | – | – | – | – | – | – | – | – | – | – | – | – | – | – | – | – | – | – | – | – | – | – | – | – | – | – | – | – | – | – | – | – | – |
| New Jersey | – | – | – | – | – | – | – | – | – | – | – | – | – | – | – | – | – | – | – | – | – | – | – | – | – | – | – | – | – | – | – | – | – | – |
Yet over much of that time the core got slower. On the transportation department’s yellow-taxi figures, measured the same way throughout, speeds fell from 9.1 mph in 2010 to 7.0 mph in 2018, nearly a quarter slower, in years when fewer vehicles came in. That doesn’t mean fewer entries slowed the streets; it means a count of entries is an incomplete description of congestion.
On the city's yellow-taxi measure, the core slowed by nearly a quarter in the 2010s, and fiscal 2026 is its lowest reading in the city's open records
Administrative Counts from an agency’s own records, such as turnstiles and toll plazas. They carry no sampling margin, but they count trips or transactions rather than people, and they cannot be cut by who the traveller is.Average speed of yellow taxis with passengers, weekdays 8 a.m. to 6 p.m., Manhattan south of 60th Street, by fiscal year, 2009 to 2026
The interactive chart needs JavaScript; its numbers are in the table below.
How to read this, and what it cannot show
One point per fiscal year (July to June; fiscal 2026 is July 2025 to June 2026). The average speed of yellow taxis traveling with passengers, weekdays 8 a.m. to 6 p.m., excluding holidays, anywhere south of 60th Street, as the city reports it in the Mayor’s Management Report. In 2017 the transportation department rebuilt fiscal 2013 to 2016 from a new database but left the earlier years as they were, so the two methods are drawn as separate lines and the rebuilt years before 2016, which the open files do not carry, are left out. The third line is the department’s own calendar-year series, one method from 2010 to 2018, from its 2019 Mobility Report. This measure follows yellow taxis only; it is not the speed of all traffic.
The city's performance indicator from the Mayor's Management Report, one figure a fiscal year (July to June: fiscal 2026 is July 2025 to June 2026, the first full year of the toll). DOT recalculated fiscal 2013-2016 with a new database in 2017 and did not recalculate the earlier years, so the two segments are drawn apart and fiscal 2013-2015 are left out. The third line is the transportation department's own calendar-year series from its 2019 Mobility Report, one method from 2010 to 2018, each point at its own year, so it runs half a year later than the fiscal year of the same number. Fiscal 2020 and 2021 are the pandemic years, when the streets emptied.
The numbers behind this chart
| Group | 2009 | 2010 | 2011 | 2012 | 2013 | 2014 | 2015 | 2016 | 2017 | 2018 | 2019 | 2020 | 2021 | 2022 | 2023 | 2024 | 2025 | 2026 |
|---|---|---|---|---|---|---|---|---|---|---|---|---|---|---|---|---|---|---|
| Fiscal 2009 to 2012 (earlier method) | 9.1 | 9.3 | 9.2 | 9.1 | – | – | – | – | – | – | – | – | – | – | – | – | – | – |
| Fiscal 2016 to 2026 | – | – | – | – | – | – | – | 7.4 | 7.1 | 7.1 | 7.0 | 8.7 | 9.8 | 8.4 | 7.8 | 6.9 | 6.9 | 6.5 |
| Calendar years 2010 to 2018, one method (Mobility Report) | – | 9.1 | 8.8 | 9.1 | 8.5 | 8.0 | 7.4 | 7.2 | 7.1 | 7.0 | – | – | – | – | – | – | – | – |
Plenty else changed inside the core too, from ride-hail and deliveries to bike lanes, bus lanes and outdoor dining. We don’t estimate how any of it affected speed; the questions at the end set out what changed and what the counts can and cannot say about it.
Twenty months clarify the count at the door, not the congestion question
So is the traffic creeping back? At the door, there is no sign of it: through mid-September 2026, fewer vehicles are entering the zone than in the same months of 2025, and the fall is in cars, pickups and vans. What the counts cannot tell us is how much of that is the toll’s doing, or whether fewer entries have made the streets faster.
The program’s stated purpose is to reduce congestion in the Manhattan core while raising money for transportation improvements. The revenue is reported directly: the state put the first year’s net revenue at more than $550 million. On congestion, the measures answer different questions: the city’s yellow-taxi indicator fell to its lowest, while the state’s before-and-after figures and the Google Maps study find speeds up.
The toll prices the way in, and the count at the door is the best-established part of the story. When the toll rises in 2028, the things worth watching are the ones that describe the traffic inside: several speed measures side by side, the vehicle-miles driven in the zone, and the share of the traffic that is taxis and for-hire cars.
Questions this raises
Where do “27 million fewer” and the 11 percent reduction come from?
From a constructed historical baseline, not a directly observed count. The governor’s anniversary release says 27 million fewer vehicles entered the zone in the toll’s first year, over 73,000 fewer a day, an 11 percent reduction. The MTA’s First Evaluation Report, linked from that release, sets out how the baseline was built: NYMTC’s October counts of about 640,000 vehicles a day in 2022 and 2023, adjusted month by month with factors from the bridge and tunnel volumes of 2022 to 2024, into twelve monthly baselines from 581,000 a day in January to 662,000 in June. Against those, it finds entries about 11 percent lower from January to October 2025. The MTA’s first weekly briefing had shown an earlier version: an average of 642,000 entries a weekday observed in October of 2022, 2023 and 2024, adjusted to 583,000 for January. The open data has only the counted side, so the 11 percent cannot be recomputed from it.
The release speaks of vehicles entering the Congestion Relief Zone, but the report’s comparison is of the zone and the two highways together, the FDR Drive and West Side Highway, because, it says, the historical counts did not consistently separate trips into the zone from trips that stayed on the highways. So the 11 percent and the 27 million describe the core, highways included, not the tolled zone alone.
The counted side reproduces. The report’s monthly averages for January to October 2025, 533,525 a day in January for instance, come out of the open file within 0.02% in every month, and the MTA’s first two weekly figures, 538,955 and 556,381 vehicles a weekday, come out at 535,327 and 556,241. Over the first year the gantries counted an average of 557,525 vehicles a day entering the core with the two highways, and 492,697 into the tolled zone proper. Twenty-seven million over 365 days is 73,973 a day; adding 73,000 to the first number gives an implied baseline of about 630,500, the average of the report’s twelve monthly baselines, and a reduction of 11.6%.
The September 2025 release said 87,000 fewer vehicles a day, 12 percent, and 17.6 million fewer since the start. The release gives the 17.6 million as fewer vehicles “compared to last year” and does not say how the daily figure was reached. If the 17.6 million runs to 31 August, as the release’s date suggests, it is about 73,600 a day over those 239 days, not 87,000, and the release does not give enough detail to reconcile the two figures on a common basis.
Our own check sets two counting systems side by side. Counted the way NYMTC counts, the two highways included and buses left out, the toll’s cameras saw about 567,000 vehicles on the midweek days of October 2025, about 8% fewer than NYMTC counted in October 2024. That points the same way as the MTA’s 11 percent, to a smaller fall, and, like it, compares two ways of counting.
Is the fall since the toll the toll’s doing?
The counts cannot say. Every comparison in them is one year against another, or inside the zone against outside it, and between any two years office attendance, the economy, weather, events and roadworks all change too. The one estimate of the toll’s own effect cited here is the working paper’s, and it is about speed: its Google Maps data, the authors note, are ill-suited to measuring changes in the number of vehicles.
What the counts can do is test the claim that started the question, and through mid-September 2026 they show no sign of traffic into the zone creeping back: on weekdays from March to 19 September, 2026 ran 3.4% below the comparable period of 2025, with a 90% matched-week range of 2.9% to 3.8% below. With holidays kept in, every weekday gives 3.3% below; medians instead of means, 3.5%; the count with the two highways, 3.4%.
From March, the comparison leaves out only holidays, on a calendar fixed in advance: federal holidays, Good Friday, the day after Thanksgiving and the days from 24 December to 1 January. A second screen drops a day whose count is more than a quarter off its month’s median, which removes the snowstorms of January and February 2026; since it reads the counts themselves, we check it, and from March it removes nothing.
The range comes from resampling matched weeks 4,000 times: the days are cut into 7-day blocks counted from 5 January, and the same block is drawn from both years together, so a March week of 2025 is always set against the same March week of 2026, and the change itself is computed on the same blocks. It shows how much the comparison moves with the weeks that happened to fall in the window. It is not a sampling margin, since the file counts the vehicles the tolling system recorded rather than a sample, and it is not an estimate of the toll’s effect.
Which vehicles and which crossings fell?
Cars, pickups and vans fell, and the taxi and for-hire class rose. On weekdays from March to 19 September, cars, pickups and vans were 6.9% below 2025, about 20,000 fewer a day, while the taxi and for-hire class was 2.4% above, about 4,500 more. Entries from New Jersey fell most among the crossings, 6.0%, and the East Side of 60th Street next, 4.9%. Peak-hour entries fell 3.9%; overnight entries, when the toll is a quarter of the peak rate, fell only about 1%.
The classes are the MTA’s, from the entries file’s own description. Cars, pickups and vans leave out the taxis and for-hire cars billed through the per-trip charge, which make up the taxi and for-hire class; a taxi or for-hire car not billed that way is tolled, and counted, in its ordinary class. So the first is not the same as private cars, and the second is not every car with taxi commission plates.
Multi-unit trucks and motorcycles show steep falls, a fifth and a quarter, but they are small classes that were already drifting down through 2025, and a change in how the gantries classify them cannot be ruled out, so we draw no conclusion from them.
Administrative Counts from an agency’s own records, such as turnstiles and toll plazas. They carry no sampling margin, but they count trips or transactions rather than people, and they cannot be cut by who the traveller is.
How to read this, and what it cannot show
One bar per group, with its 90% matched-week range. The FDR Drive and West Side Highway are counted by the gantries but not tolled.
Did every month fall, weekends included?
Every weekday month did. All nine months of 2026 to date were below the same month of 2025 on weekdays, and each month’s range sits below zero, though a month holds only three to five weeks, so those ranges are rough. Weekends fell less: from March, weekend entries were 1.7% below 2025, with a matched-week range of 0.7% to 2.8% below, so weekends are a little lower too.
Administrative Counts from an agency’s own records, such as turnstiles and toll plazas. They carry no sampling margin, but they count trips or transactions rather than people, and they cannot be cut by who the traveller is.
How to read this, and what it cannot show
One bar per month, with its 90% matched-week range; January starts on the 5th in both years and September ends on the 19th.
Why do the speed measures point different ways?
They follow different traffic over different windows and answer different questions, so they can point different ways without any of them being wrong. The city’s indicator is the average speed of yellow taxis carrying passengers on weekdays from 8 a.m. to 6 p.m., anywhere south of 60th Street, averaged over a fiscal year from July to June. It read 6.9 mph in fiscal 2025, half of which came before the toll, and 6.5 mph in fiscal 2026. The city’s open records of it reach back to fiscal 2009, with a change of method in 2017 that leaves fiscal 2013 to 2015 out of the open files.
The state’s and the MTA’s figures compare the toll’s first year with the year before. The anniversary release put weekday vehicle speeds in the zone up 4% on 2024, weekend speeds up 6.2% and bus speeds up 2.3%, without saying where the vehicle speeds come from. The MTA’s open files point the same way for the first months: speeds of taxis and app-based cars on trips, from their GPS tracks, rose 3.1% inside the zone in January to August 2025 against the same months of 2024, while speeds in the rest of the city fell 0.9%; the year before, the zone had slowed faster than the rest of the city. That file stops in August 2025. Buses on segments inside the zone ran 2.7% faster at weekday peak in the first eight months of 2025 than in 2024, then 1.8% slower in 2026.
The working paper asks a third question: how fast would the zone have been without the toll? It follows the speeds of trips routed through Google Maps from September 2024 to June 2026, in New York and in Philadelphia, Boston, Chicago, Atlanta and Baltimore, and builds from the five cities a stand-in for a New York without the toll, a method called a generalized synthetic control. Against that stand-in, speeds in the zone during the tolled hours were 11% higher on average, 15% in the first four months and 10% after, and roads outside the zone got faster too, most of all those that drivers heading into it use.
In the paper’s own data, the raw average speed on road segments in the zone rose from 7.1 mph in the four months before the toll to 7.7 mph in the eighteen after, and the authors write that, under the method’s assumptions, the toll’s effect “can fully account for” that rise. The paper was revised in August 2026 and has not been peer-reviewed. It is the strongest causal evidence on speed set out here, and it rests on its five cities standing in for New York and on its Google Maps measurements; the yellow-taxi indicator does not contradict it, since it measures a different set of trips.
The MTA also publishes vehicle-miles driven inside the zone from two commercial probe-data models. For 2025 against 2024 they agree that total vehicle-miles fell but not by how much, 4.1% and 11.3%; for the months of 2026 so far against the same months of 2025 they point in opposite directions, so we draw nothing from them.
The MTA's taxi and ride-hail speeds rose in the toll's first months, inside the zone only
Administrative Counts from an agency’s own records, such as turnstiles and toll plazas. They carry no sampling margin, but they count trips or transactions rather than people, and they cannot be cut by who the traveller is.Average speed of yellow taxis and app-based cars on trips, by zone, monthly, October 2019 to August 2025
The interactive chart needs JavaScript; its numbers are in the table below.
How to read this, and what it cannot show
Miles driven on trips divided by hours on trips, from the GPS tracks of yellow taxis and app-based cars, which the taxi commission provides and the city’s transportation department processes for the MTA. The hours of the day are not stated, so the levels differ from the city’s weekday-daytime indicator. The 2020 peak is the pandemic.
MTA monthly zonal speeds from the GPS tracks of yellow taxis and high-volume for-hire vehicles on trips, provided by the TLC and processed by NYC DOT: miles driven on trips divided by hours on trips. The MTA has not extended the file past August 2025. Hours of the day are not stated, so the levels differ from the city's weekday-daytime indicator.
The numbers behind this chart
| Group | Oct 2019 | Nov 2019 | Dec 2019 | Jan 2020 | Feb 2020 | Mar 2020 | Apr 2020 | May 2020 | Jun 2020 | Jul 2020 | Aug 2020 | Sep 2020 | Oct 2020 | Nov 2020 | Dec 2020 | Jan 2021 | Feb 2021 | Mar 2021 | Apr 2021 | May 2021 | Jun 2021 | Jul 2021 | Aug 2021 | Sep 2021 | Oct 2021 | Nov 2021 | Dec 2021 | Jan 2022 | Feb 2022 | Mar 2022 | Apr 2022 | May 2022 | Jun 2022 | Jul 2022 | Aug 2022 | Sep 2022 | Oct 2022 | Nov 2022 | Dec 2022 | Jan 2023 | Feb 2023 | Mar 2023 | Apr 2023 | May 2023 | Jun 2023 | Jul 2023 | Aug 2023 | Sep 2023 | Oct 2023 | Nov 2023 | Dec 2023 | Jan 2024 | Feb 2024 | Mar 2024 | Apr 2024 | May 2024 | Jun 2024 | Jul 2024 | Aug 2024 | Sep 2024 | Oct 2024 | Nov 2024 | Dec 2024 | Jan 2025 | Feb 2025 | Mar 2025 | Apr 2025 | May 2025 | Jun 2025 | Jul 2025 | Aug 2025 |
|---|---|---|---|---|---|---|---|---|---|---|---|---|---|---|---|---|---|---|---|---|---|---|---|---|---|---|---|---|---|---|---|---|---|---|---|---|---|---|---|---|---|---|---|---|---|---|---|---|---|---|---|---|---|---|---|---|---|---|---|---|---|---|---|---|---|---|---|---|---|---|---|
| Inside the zone (the CBD) | 8.0 | 8.0 | 8.0 | 9.3 | 9.0 | 9.7 | 16.4 | 15.2 | 13.3 | 12.4 | 12.0 | 11.4 | 10.9 | 11.2 | 11.0 | 12.2 | 11.4 | 11.2 | 10.8 | 10.5 | 9.8 | 10.1 | 10.3 | 9.6 | 9.2 | 9.2 | 9.3 | 10.7 | 9.6 | 9.5 | 9.3 | 9.1 | 9.0 | 9.6 | 9.5 | 8.5 | 8.7 | 8.7 | 8.2 | 9.5 | 9.3 | 9.1 | 9.0 | 8.6 | 8.7 | 8.9 | 9.2 | 8.0 | 8.2 | 8.2 | 8.0 | 9.3 | 9.0 | 8.8 | 8.6 | 8.2 | 8.4 | 8.7 | 8.8 | 8.0 | 8.1 | 8.3 | 7.8 | 9.7 | 9.3 | 9.3 | 8.9 | 8.3 | 8.6 | 8.7 | 9.2 |
| Next to the zone | 11.8 | 11.7 | 12.1 | 13.1 | 13.1 | 13.3 | 18.5 | 16.9 | 14.9 | 14.3 | 13.9 | 13.0 | 12.7 | 13.1 | 12.7 | 13.9 | 13.1 | 13.3 | 12.8 | 12.8 | 12.4 | 13.4 | 13.6 | 12.2 | 12.1 | 12.2 | 12.9 | 13.2 | 12.5 | 12.5 | 12.4 | 12.1 | 12.3 | 13.4 | 13.3 | 11.1 | 12.0 | 12.2 | 12.3 | 12.9 | 12.9 | 12.7 | 12.6 | 11.9 | 12.4 | 13.2 | 13.2 | 11.7 | 11.9 | 11.9 | 12.2 | 12.8 | 12.7 | 12.5 | 12.5 | 11.7 | 12.3 | 13.1 | 13.2 | 11.8 | 12.0 | 12.1 | 11.9 | 12.9 | 12.7 | 12.8 | 12.4 | 11.6 | 12.1 | 12.5 | 12.8 |
| The rest of the city | 16.9 | 16.3 | 16.6 | 17.7 | 17.1 | 17.6 | 19.5 | 18.1 | 17.1 | 16.8 | 16.7 | 16.1 | 16.2 | 16.5 | 16.1 | 17.3 | 16.0 | 16.2 | 16.2 | 16.4 | 15.9 | 16.9 | 17.1 | 16.5 | 16.4 | 16.9 | 17.4 | 17.5 | 16.8 | 16.9 | 17.1 | 16.8 | 16.4 | 17.6 | 17.4 | 17.3 | 16.9 | 16.8 | 16.8 | 17.4 | 17.2 | 16.6 | 17.2 | 16.5 | 16.6 | 17.4 | 17.1 | 16.3 | 16.5 | 16.6 | 16.7 | 17.2 | 16.8 | 16.4 | 16.8 | 16.0 | 16.2 | 17.1 | 16.8 | 16.2 | 16.5 | 16.4 | 16.4 | 17.1 | 16.8 | 16.6 | 16.5 | 15.9 | 16.1 | 16.6 | 16.6 |
What else changed inside the core: ride-hail and the street itself?
A great deal, though we don’t estimate how any of it affected traffic speed. In 2013, by one consultant’s estimate, there was about one app ride for every hundred taxi trips; by June 2019 the app companies carried about 700,000 trips a day across the city. An analysis of trip records by Schaller Consulting found the miles taxis and ride-hail cars drove in the core on a weekday up 36% from 2013 to 2017, and the city’s 2019 study of the for-hire industry called ride-hail’s growth “not the only cause” of that decade’s slowdown but “certainly an important factor”. In the city’s own traffic counts in the fall of 2018, for-hire cars, the app companies’ included, were nearly 30% of the traffic it sampled in Manhattan, and for-hire cars and taxis together roughly half. The data here cannot rank that change against the others that affect congestion, from deliveries and construction to curb use and office attendance.
The street changed too. Protected bike lanes inside the zone grew from about 3 miles of street at the end of 2007 to about 50 in 2026, most of the growth after 2017. Among the bus lanes in effect today, the miles inside the zone grew by up to about half after 2010, and in 2020 the city’s pandemic program approved some 2,400 applications for roadway seating inside the zone; those are approvals, not a count of setups on the street. These figures describe how street space is allocated. A protected lane can replace parking, narrow a lane or take one, and a bus lane still moves people, so none of them can be translated into an equivalent loss of general-traffic capacity.
Protected bike lanes in the zone grew from about 3 miles to 50 after 2007
Administrative Counts from an agency’s own records, such as turnstiles and toll plazas. They carry no sampling margin, but they count trips or transactions rather than people, and they cannot be cut by who the traveller is.Street miles of bike lane inside the Congestion Relief Zone at the end of each year, 2000 to 2026
The interactive chart needs JavaScript; its numbers are in the table below.
How to read this, and what it cannot show
From the transportation department’s bike-route file, which keeps retired segments with their install and retirement dates: street (centerline) miles of protected lanes and of painted lanes inside the zone’s boundary at the end of each year; 2026 is the file as retrieved in September. Off-street paths are left out, including the stretches of the riverside greenways inside the zone’s boundary. Bus lanes are not drawn: the department’s bus-lane file holds only the lanes in effect now, in lane miles, so they are described in the questions below instead.
NYC DOT's bike-route file, which keeps retired segments with their install and retirement dates: street (centerline) miles of protected lanes on the street and of painted lanes on 31 December of each year inside the MTA's zone boundary, one record per street segment on each date. 2026 is the file as retrieved in September 2026. Off-street paths, riverside greenways included, are left out. Bus lanes are not drawn here: DOT's bus-lane file holds only the lanes in effect now and counts lane miles, so it cannot be set on the same footing; its figures are in the questions below.
The numbers behind this chart
| Group | 2000 | 2001 | 2002 | 2003 | 2004 | 2005 | 2006 | 2007 | 2008 | 2009 | 2010 | 2011 | 2012 | 2013 | 2014 | 2015 | 2016 | 2017 | 2018 | 2019 | 2020 | 2021 | 2022 | 2023 | 2024 | 2025 | 2026 |
|---|---|---|---|---|---|---|---|---|---|---|---|---|---|---|---|---|---|---|---|---|---|---|---|---|---|---|---|
| Protected bike lanes (street miles) | 1.5 | 1.5 | 1.5 | 1.7 | 2.2 | 2.2 | 2.2 | 2.6 | 4.1 | 6.0 | 9.6 | 10.5 | 12.8 | 12.9 | 14.2 | 14.9 | 17.3 | 20.0 | 26.9 | 32.6 | 34.5 | 39.3 | 42.1 | 44.4 | 48.2 | 48.1 | 49.8 |
| Painted bike lanes (street miles) | 5.3 | 5.6 | 5.9 | 6.4 | 10.2 | 10.2 | 14.0 | 22.0 | 25.7 | 24.8 | 25.3 | 26.1 | 30.6 | 36.0 | 35.7 | 36.3 | 35.9 | 36.5 | 36.5 | 38.8 | 39.0 | 37.9 | 36.0 | 35.0 | 35.0 | 35.5 | 35.5 |
What does it cost to drive in, and who pays what?
A car with an E-ZPass pays $9 to enter the zone at peak, 5 a.m. to 9 p.m. on weekdays and 9 a.m. to 9 p.m. at weekends, and $2.25 overnight, once a day. The rates are 60% of the ones first adopted and stay there to 2027; they rise to $12 at peak in 2028 and to the full $15 in 2031. Drivers who enter at peak through one of the four tolled tunnels, the Lincoln, Holland, Queens-Midtown and Hugh L. Carey, get a credit of up to $3. Motorcycles pay $4.50, small trucks $14.40 and large trucks $21.60 at peak, and there is a discount plan for drivers on low incomes.
Instead of the daily toll, taxis and for-hire cars licensed by the taxi commission are eligible for a per-trip charge, paid by the passenger for every trip to, from, within or through the zone: $1.50 in an app-based car and $0.75 in a taxi, green cab or black car. One that is not billed through that plan pays the toll for its vehicle class, which is also how the toll’s counts classify it. The per-trip charge comes on top of the state’s congestion surcharge, collected since 2 February 2019 on every taxi and for-hire trip that begins in, ends in or passes through Manhattan south of 96th Street: $2.75 in a for-hire car, $2.50 in a yellow taxi and $0.75 for a shared ride. The city first paused new for-hire licenses in August 2018; the app companies ran about 86,000 cars in June 2019 and about 85,000 in June 2026.
Tolls were part of the story long before the congestion toll: the four tunnels into the core have long charged, while the bridges and the avenues across 60th Street charged nothing.
What happened in the pandemic, and at the tunnels?
In the fall of 2020, the number of people entering the core by subway fell by two thirds while the number entering by car fell by only a fifth, and car traffic stayed far closer to its old level than transit did. By NYMTC’s count, the number of people entering the core by car in the fall of 2023 was 12% below 2019, by subway 33% below. The counting problems described below make the fall by car look larger than it was, if anything, so the gap with the subway is at least that wide.
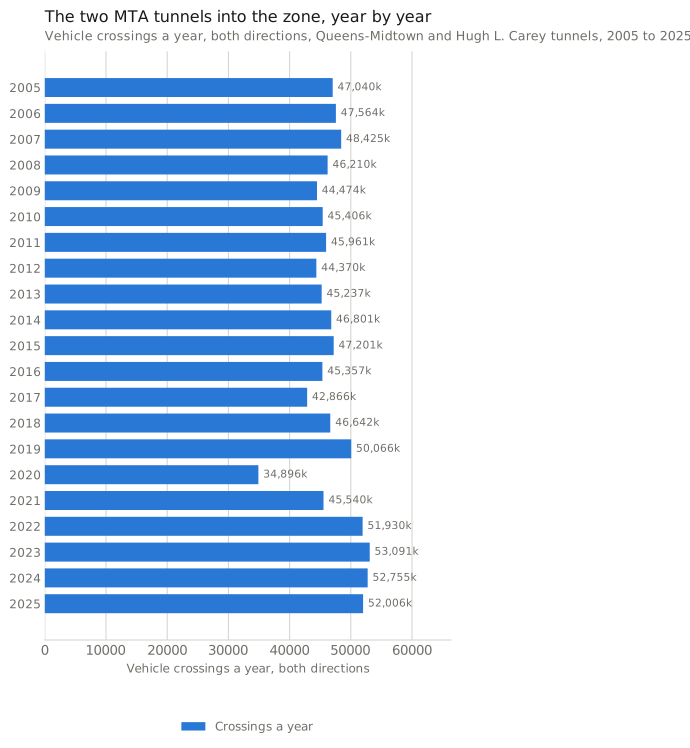
The MTA’s two tunnels into the zone, the Queens-Midtown and the Hugh L. Carey, carried 50.1 million crossings in both directions in 2019, 34.9 million in 2020, a fall of 30%, and 53.1 million in 2023, the most since at least 2005. Since the toll the direction into Manhattan has eased. From 1 January to 15 September, crossings toward Manhattan were 1.8% fewer in 2025 than in 2024 and 4.1% fewer in 2026 than in 2025. Drivers through these tunnels get a credit against the toll, so the tunnels are not a clean test of it; some of their traffic also joins the FDR Drive or West Side Highway without entering the tolled zone.
Administrative Counts from an agency’s own records, such as turnstiles and toll plazas. They carry no sampling margin, but they count trips or transactions rather than people, and they cannot be cut by who the traveller is.
How to read this, and what it cannot show
Reconciled toll transactions to 2024; 2025 from the MTA’s hourly crossings file, which counts every vehicle whether or not it pays and reads 0.2% to 0.6% higher than the reconciled file where the two overlap.
How was NYMTC’s long count checked and corrected?
NYMTC’s own long table of vehicles entering the core, Table 1A of its 2024 report, prints two wrong totals. For 2023 it prints 699,294, but its own four sectors add up to 629,889, which is what its one-year tables show; for 2024 it prints 785,354, which is the number of people who entered by car, not the number of vehicles. We use the one-year tables for both years, 629,889 and 618,970, and check that the long table agrees with them for 2022, which it does to the vehicle.
One break is left in and marked, and three years flagged. NYMTC lost most of its files and databases on 11 September 2001, and says its data for 1999 is largely absent, so the 1999 total (844,000, the highest printed) rests on partial data and we take the peak from 1998. The 2019 Brooklyn Bridge count was later checked against a transportation department video count, which found 64,560 vehicles inbound, far fewer than the road tubes recorded, so the 2019 total is too high; NYMTC also notes that its 2018 Queensboro Bridge count is noticeably low. We therefore use 2017 as the last clean count before the pandemic: by 2017 the count was down about a sixth from 1998. From 2021 NYMTC stopped counting vehicles that cross the Queensboro Bridge’s upper ramp and pass over the zone; the Queens sector fell from 99,130 in 2020 to 79,298 in 2021, partly for that reason. The comparison that avoids the Queensboro breaks, the 60th Street line and the Brooklyn and New Jersey crossings, fell by nearly a fifth from 1998 to 2018 and by a quarter from 1998 to 2024.
The count day is a single October weekday for the Hudson tunnels and a two-week October average for the bridges and 60th Street. App-based cars are counted with autos, and buses separately; the October gantry comparison leaves buses out of both sides and keeps the FDR Drive and West Side Highway in both. By crossing, the October 2025 gantry counts were 5.9% below NYMTC’s 2024 count from Brooklyn, 7.9% at 60th Street, 9.1% from New Jersey and 13.5% from Queens.
How were the bike lanes, bus lanes and outdoor dining counted?
The transportation department’s bike-route file keeps every segment it has retired, with its install and retirement dates, so the network can be rebuilt as it stood at the end of each year. We keep one record per street segment on each date, because replacement records often carry their predecessor’s install date, and count street (centerline) miles inside the MTA’s zone polygon, cutting each segment into pieces of 10 meters or less and keeping the pieces whose middle falls inside. Protected means the department’s class I on the street; painted, class II. Off-street paths are left out, including the short stretches of riverside greenway inside the zone’s boundary; most of the greenways run along the FDR Drive and West Side Highway, which the boundary leaves out. Keeping one record per segment matters most in the early years: without it, 2007 would show about 3.4 miles of protected lane rather than 2.6. A retired record does not always mean a removed lane, the department warns, since map updates also retire records.
The bus-lane file holds only the lanes in effect now, with the year each began, so a count by year is a floor for earlier years: lanes removed since are missing. Among today’s lanes, 23.0 lane miles inside the zone had begun by 2010 and 33.9 by 2025, so the growth since 2010 is at most about half. The file counts lane miles, so a street with a lane each way counts twice; lanes the file lists twice with identical details are counted once, and lanes the file calls shared are included. It includes the 14th Street busway (about 2 miles of lane). The dining figures are applications approved for roadway seating in 2020 under the pandemic program, self-certified and not a count of setups on the street, and licenses for roadway seating under the permanent program.
Where this data goes quiet
There is no count from the gantries before the toll, so every “fewer than before” figure is either a model (the MTA’s) or a comparison with a different counting method (ours, with NYMTC’s). NYMTC has not yet published a 2025 count. The MTA’s taxi and ride-hail speeds stop in August 2025, and the city’s speed indicator is one number a year for yellow taxis only.
The taxi commission publishes app-based trips for the city as a whole, not for the zone. Nothing here counts the people inside the vehicles that enter, who they are or why they come, and nothing in these counts isolates the toll from everything else that changed in 2025 and 2026. The working paper’s estimate rests on its five comparison cities standing in for a New York without the toll: anything else that changed in New York alone over those months would be read as the toll’s effect, and the paper has not yet been through peer review.
Under the hood: data, definitions, methods and the full results
Gantry entries. The MTA’s Congestion Relief Zone file has one row per ten minutes, detection group and vehicle class; we sum it on the server by day, vehicle class, crossing region and toll period (52,332 rows, 5 January 2025 to 19 September 2026, no day missing). Tolled-zone entries leave out the FDR Drive and West Side Highway, which the gantries count as excluded roadways; the MTA’s “CBD” figures include them. Vehicle classes are the MTA’s: cars, pickups and vans, which leave out the taxis and for-hire vehicles billed through the per-trip charge; single-unit and multi-unit trucks; buses; motorcycles; and the taxi and for-hire class of vehicles billed per trip. A taxi or for-hire vehicle not billed per trip is tolled, and counted, in its ordinary class.
Holidays, screened days and ranges. A day is left out of the year-on-year comparison if it falls on a calendar fixed in advance: a federal holiday, Good Friday, the day after Thanksgiving or the week from 24 December to 1 January. A second screen drops a day whose entries are more than a quarter off the median of its month and day type; it removes 25-26 January and 22-23 February 2026, the two snowstorms, and the Fourth of July in both years, which the calendar already drops, and from March, the window of every pooled comparison, it removes nothing. Comparisons use the same calendar window in both years, 5 January (or 1 March) to 19 September. The ranges resample matched 7-day blocks, counted from 5 January in each year and drawn from both years together, 4,000 times (fixed seed), and report the 5th and 95th percentiles of the ratio of means; the change itself is the ratio of means over the same blocks. At a month’s edge a block can hold weekdays in one year and only weekend days in the other; such days, seven in all, sit out of both. The monthly entries chart uses the same window where the two years overlap.
The cordon count. NYMTC’s Hub Bound Table 1A for 1990 to 2022, with 2023 from the sum of its sectors and 2024 from Table 16, each checked against Table 23A. The October comparison uses the gantry weekdays from Tuesday to Thursday in October 2025 (14 days), buses out, highways in; September and November give 8.6% and 8.2% below, every October weekday 8.0% below, and against NYMTC’s 2022 to 2024 average, 9.7% below.
Speeds, trips and lanes. Vehicle-miles are compared as totals over the months both years have, each month’s daily figure times its days. The city’s indicator is read from the Mayor’s Management Report’s open files, one value a fiscal year, and the working paper’s figures from its revised text; the Mobility Report’s calendar-year taxi speeds, 9.1 mph in 2010 to 7.0 in 2018, tell the same story. The taxi commission’s June figures are average trips a day in June. Lane miles use the MTA’s zone polygon, with lengths from the local scale of the WGS84 ellipsoid.
Files. Every number above is in results.json, written by analysis.py, which also verifies each figure quoted from a report, and the class definitions quoted from the entries file’s description, against the saved copy before using it. data.csv holds the gantry entries by day, vehicle class, crossing and toll period; long_view.csv holds the thirty-year series, one row per source, series and year.
Sources
- Metropolitan Transportation Authority — Congestion Relief Zone Vehicle Entries: Beginning 2025 (Toll-gantry detections, 5 January 2025 to 19 September 2026, summed by day, vehicle class, crossing and toll period; retrieved 28 September 2026) — About 500,000 entries into the tolled zone on an average weekday in the first year (501,055); weekdays from March to 19 September 2026 3.4% below the comparable period of 2025; cars, pickups and vans 6.9% lower; the taxi and for-hire class (vehicles billed through the per-trip charge) 2.4% higher and 36.6% of weekday entries in year one
- Metropolitan Transportation Authority — Congestion Relief Zone Vehicle Entries: data dictionary (column descriptions) (Retrieved 1 October 2026) — Class 1, cars, pickups and vans, does not include the taxis and for-hire vehicles subject to the per-trip toll; taxis and for-hire vehicles not charged in the per-trip charge plan are tolled by vehicle class and appear in those categories
- New York Metropolitan Transportation Council — Hub Bound Travel Data Report 2024 and its Excel tables (2024 edition (count day 16 October 2024), with historical tables to 1932; retrieved 28 September 2026) — Vehicles entering Manhattan south of 60th Street on a fall business day: 836,000 in 1998, 698,089 in 2017, 618,970 in 2024 (NYMTC lost most of its 1999 files on 11 September 2001, and from 2021 its Queensboro count leaves out traffic passing over the zone) (Tables 1A, 16 and 23A; Table 1A's printed 2023 and 2024 totals are wrong and are replaced); people entering by car and by subway, 2019 and 2020
- New York Metropolitan Transportation Council — Addendum to the 2019 Hub Bound Travel Data Report (April 2021 (NYC DOT video count of November 2019)) — Brooklyn Bridge, 64,560 vehicles inbound and 56,943 outbound on the video count, well below the report's 2019 road-tube count
- NYC Mayor's Office of Operations — Mayor's Management Report agency performance indicators (average vehicular travel speed in the Manhattan Central Business District) (Fiscal 2016 to fiscal 2026; retrieved 29 September 2026) — The average speed of yellow taxis traveling with passengers, 8 a.m. to 6 p.m. on weekdays, south of 60th Street: 7.0 mph in fiscal 2019, 9.8 in fiscal 2021, 6.9 in fiscal 2024 and 2025, 6.5 in fiscal 2026
- NYC Mayor's Office of Operations — FY03-FY12 MMR agency performance indicators (Fiscal 2003 to fiscal 2012) — The same indicator for fiscal 2009 to 2012: 9.1, 9.3, 9.2 and 9.1 mph
- NYC Mayor's Office of Operations — Mayor's Management Report, Fiscal 2026, Department of Transportation (Published September 2026) — Average vehicular travel speed in the Manhattan CBD 8.4, 7.8, 6.9, 6.9 and 6.5 mph in fiscal 2022 to 2026
- NYC Department of Transportation — New York City Mobility Report (2019) (2019 edition, calendar years 2010 to 2018) — Average taxi speeds in the Manhattan CBD from 9.1 mph in 2010 to 7.0 in 2018, 'down by 22% since 2010' in 2017
- Metropolitan Transportation Authority — Central Business District Taxi and For-Hire Vehicle Speeds: Beginning October 2019 (Monthly, October 2019 to August 2025 (not extended since); retrieved 28 September 2026) — Speeds on trips from taxi and ride-hail GPS tracks: inside the zone, January to August 2025 3.1% faster than the same months of 2024; the rest of the city 0.9% slower
- Metropolitan Transportation Authority — Central Business District Bus Speeds: Beginning 2023 (Monthly, January 2023 to August 2026; retrieved 28 September 2026) — Weekday peak speeds on segments inside the zone 2.7% higher in January to August 2025 than 2024, then 1.8% lower in 2026
- Metropolitan Transportation Authority — Vehicle Miles Traveled in the Central Business District: Beginning 2024 (Monthly from January 2024; the two models to June and May 2026) — Two probe-data models: total vehicle-miles in the zone 4.1% and 11.3% lower in 2025 than 2024; for the months of 2026 so far against the same months of 2025, the models differ in sign
- Metropolitan Transportation Authority — Bridges & Tunnels Daily Traffic Rates by Vehicle Class: 2005-2024 (Daily, 2005 to 2024 (deprecated after 2024)) — Queens-Midtown and Hugh L. Carey tunnels, both directions: 50.1 million crossings in 2019, 34.9 million in 2020, 53.1 million in 2023
- Metropolitan Transportation Authority — Bridges and Tunnels Hourly Crossings: Beginning 2019 (Hourly, 1 January 2019 to 15 September 2026; retrieved 28 September 2026) — Crossings toward Manhattan at the two tunnels, 1 January to 15 September: 1.8% fewer in 2025 than 2024, 4.1% fewer in 2026 than 2025
- NYC Taxi & Limousine Commission — monthly data reports (Monthly to July 2026; retrieved 28 September 2026) — Trips a day in June: yellow taxis 494,137 in 2010, 231,335 in 2019, 127,837 in 2026; the app companies 700,036 in 2019 and 707,670 in 2026
- NYC Department of Transportation — New York City Bike Routes (Current and retired segments with install and retirement dates, retrieved 28 September 2026) — Protected bike lanes inside the zone, street miles: 2.6 at the end of 2007, 32.6 at the end of 2019, 49.8 in September 2026
- NYC Department of Transportation — Bus Lanes, Local Streets (Lanes in effect at the September 2026 retrieval, with the year each began) — Bus-lane miles inside the zone among today's lanes, exact duplicates counted once: 23.0 begun by 2010, 33.9 by 2025, including the 14th Street busway (2019)
- NYC Department of Transportation — Open Restaurant Applications (Historical) (Applications June 2020 to August 2023; licenses to 25 September 2026) — 2,444 applications approved for roadway seating inside the zone in 2020, self-certified
- NYC Department of Transportation — Dining Out NYC Locations (Licences issued October 2024 to 25 September 2026) — 430 roadway and 661 sidewalk licenses inside the zone
- Metropolitan Transportation Authority — Central Business District Geofence (Boundary as of June 2024) — The zone polygon used to place bike lanes, bus lanes and outdoor dining inside or outside the zone
- Office of the Governor — Less Traffic, Better Transit: On Its First Anniversary, Governor Hochul Celebrates Transformational Success of Congestion Pricing (5 January 2026 (Internet Archive copy of 8 July 2026 saved, since the site refuses scripts)) — 27 million fewer vehicles entering the zone in the first year; over 73,000 fewer a day, an 11 percent reduction on average; weekday vehicle speeds in the zone up 4 percent on 2024 and bus speeds up 2.3 percent; over $550 million in net revenue
- Office of the Governor — Less Traffic, Safer Streets: As Summer Comes to an End, Governor Hochul Highlights Continued Success of Congestion Pricing (9 September 2025 (Internet Archive copy saved)) — Down 12 percent; 87,000 fewer vehicles a day; 17.6 million fewer vehicles since the program started 'compared to last year'
- Streetsblog NYC — Congestion Pricing Update: Fewer Than 500K Vehicles a Day Are Driving into the Central Business District (27 January 2025) — The MTA's first weekly counts (538,955 and 556,381 CBD entries a weekday) and its January baseline of 583,000 built from Hub Bound counts
- Metropolitan Transportation Authority — MTA Board Approves Phasing In the Congestion Relief Zone Toll (18 November 2024 (Internet Archive copy saved, since the site refuses scripts)) — $9 peak and $2.25 overnight for cars in 2025-2027; $12 and $3 in 2028-2030; the full rates from 2031
- Metropolitan Transportation Authority — About the Congestion Relief Zone toll (As of 10 April 2026 (Internet Archive copy saved)) — Peak hours; crossing credits of up to $3 at the four tolled tunnels; taxis and for-hire vehicles licensed by the taxi commission are eligible for a per-trip charge of $1.50 or $0.75 instead of the daily toll; $15 in 2031
- New York State Department of Taxation and Finance — Congestion surcharge (Page updated 30 December 2025) — $2.75 a for-hire trip, $2.50 a medallion taxi trip, $0.75 a pool trip, in Manhattan south of 96th Street
- New York State Department of Taxation and Finance — Important Notice N-19-2 (1 February 2019) — Collection of the surcharge from 12:01 a.m. on Saturday 2 February 2019
- NYC Taxi & Limousine Commission — Commissioner's Corner, September 2018 (September 2018) — Local Law 147 of 2018, signed on 14 August 2018, pausing new for-hire vehicle licenses
- National Bureau of Economic Research — The Network-Wide Effects of Congestion Pricing: Evidence from New York City (Working Paper 33584; Cook, Kreidieh, Vasserman, Allcott, Arora, Tomkins, Turkel and van Sambeek) (March 2025, revised August 2026; traffic data September 2024 to June 2026; not peer-reviewed) — Google Maps road-segment speeds and a generalized synthetic control with Philadelphia, Boston, Chicago, Atlanta and Baltimore as comparisons: cordon-area speeds about 11% above the no-toll counterfactual, easing from 15% in the first four months to 10% thereafter; speeds also rose outside the cordon; the raw average on road segments in the zone rose from 7.1 mph in the four months before the toll to 7.7 mph in the eighteen after
- Tobin Center for Economic Policy, Yale University — New York's Congestion Pricing Sped Up Traffic Across the City (Policy brief, August 2026) — The paper's non-technical summary: driving in the CBD about 11% faster, with gains that have persisted since the launch
- Metropolitan Transportation Authority — Congestion Relief Zone Tolling: First Evaluation Report (January 2026, covering 5 January to 31 October 2025 (Internet Archive copy of 5 January 2026 saved, since the site refuses scripts)) — The baseline: NYMTC's October counts of about 640,000 vehicles a day in 2022 and 2023, adjusted by month with factors from 2022-2024 bridge and tunnel volumes (581,000 a day in January to 662,000 in June); entries to the zone and the two highways together about 11 percent below it from January to October 2025, more than 21.5 million fewer; the historical counts do not separate trips into the zone from trips on the highways alone
- Metropolitan Transportation Authority — Congestion Relief Zone Tolling: Week One Update (January 2025 (saved by hand, since the site refuses scripts)) — The baseline: 2022-2024 October weekday entries of 642,000, adjusted for January to 583,000
- Federal Highway Administration — Finding of No Significant Impact, Central Business District (CBD) Tolling Program (June 2023 (saved by hand)) — The project purpose: to reduce traffic congestion in the Manhattan CBD in a manner that will generate revenue for future transportation improvements
- Schaller Consulting — Empty Seats, Full Streets: Fixing Manhattan's Traffic Problem (21 December 2017) — Taxi and ride-hail vehicles in the CBD up 59% from 2013 to 2017 and their weekday mileage up 36%; taxi trips 378,000 to 250,000 a weekday while ride-hail trips rose from virtually none to 202,000
- NYC Taxi & Limousine Commission and Department of Transportation — Improving Efficiency and Managing Growth in New York's For-Hire Vehicle Sector (Final report, June 2019) — Midtown weekday speeds 6.1 mph in November 2010 and 4.3 in November 2018; for-hire vehicles nearly 30% of the traffic sampled in Manhattan, and with taxis roughly half, in the fall 2018 counts; ride-hail growth 'not the only cause' of the slowdown but 'certainly an important factor'
How to cite
Reference
BibTeX
Quote the version: a correction bumps it, and the corrections log says what changed. Charts can be embedded from the “Embed this chart” link under each one.